(tricklism is easier than structural reform)
“The Fed can keep spending as long as inflation stays low, hoping that eventually there will be a strong economic rebound.” Spitznagel
Fiscal/Monetary Stimulus
When does monetary and fiscal policy/stimulus fail? (24-25 years from now depending on the methods: GDP growth slowing OR M2V declining.)
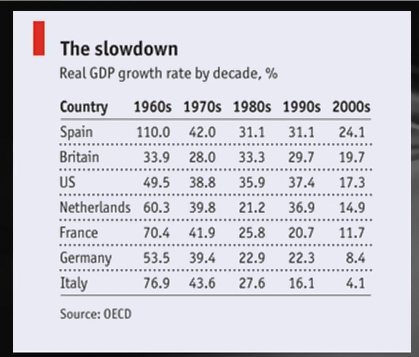
After 2008, a see-saw monetary policy change has occurred that will last the next 20-30 years. From my charts below, the GDP current growth at 2% is falling an average of 0.08% per year giving 25 years to cross the 0 threshold. The 2008 event was just as important as the creation of the Fed in 1913. All demographic and wage/job trends reinforce the declining growth as well. Policy is all ‘tricklism’ and will continue to be so as it will take another 25 years for growth to hit a 0% crossing threshold.
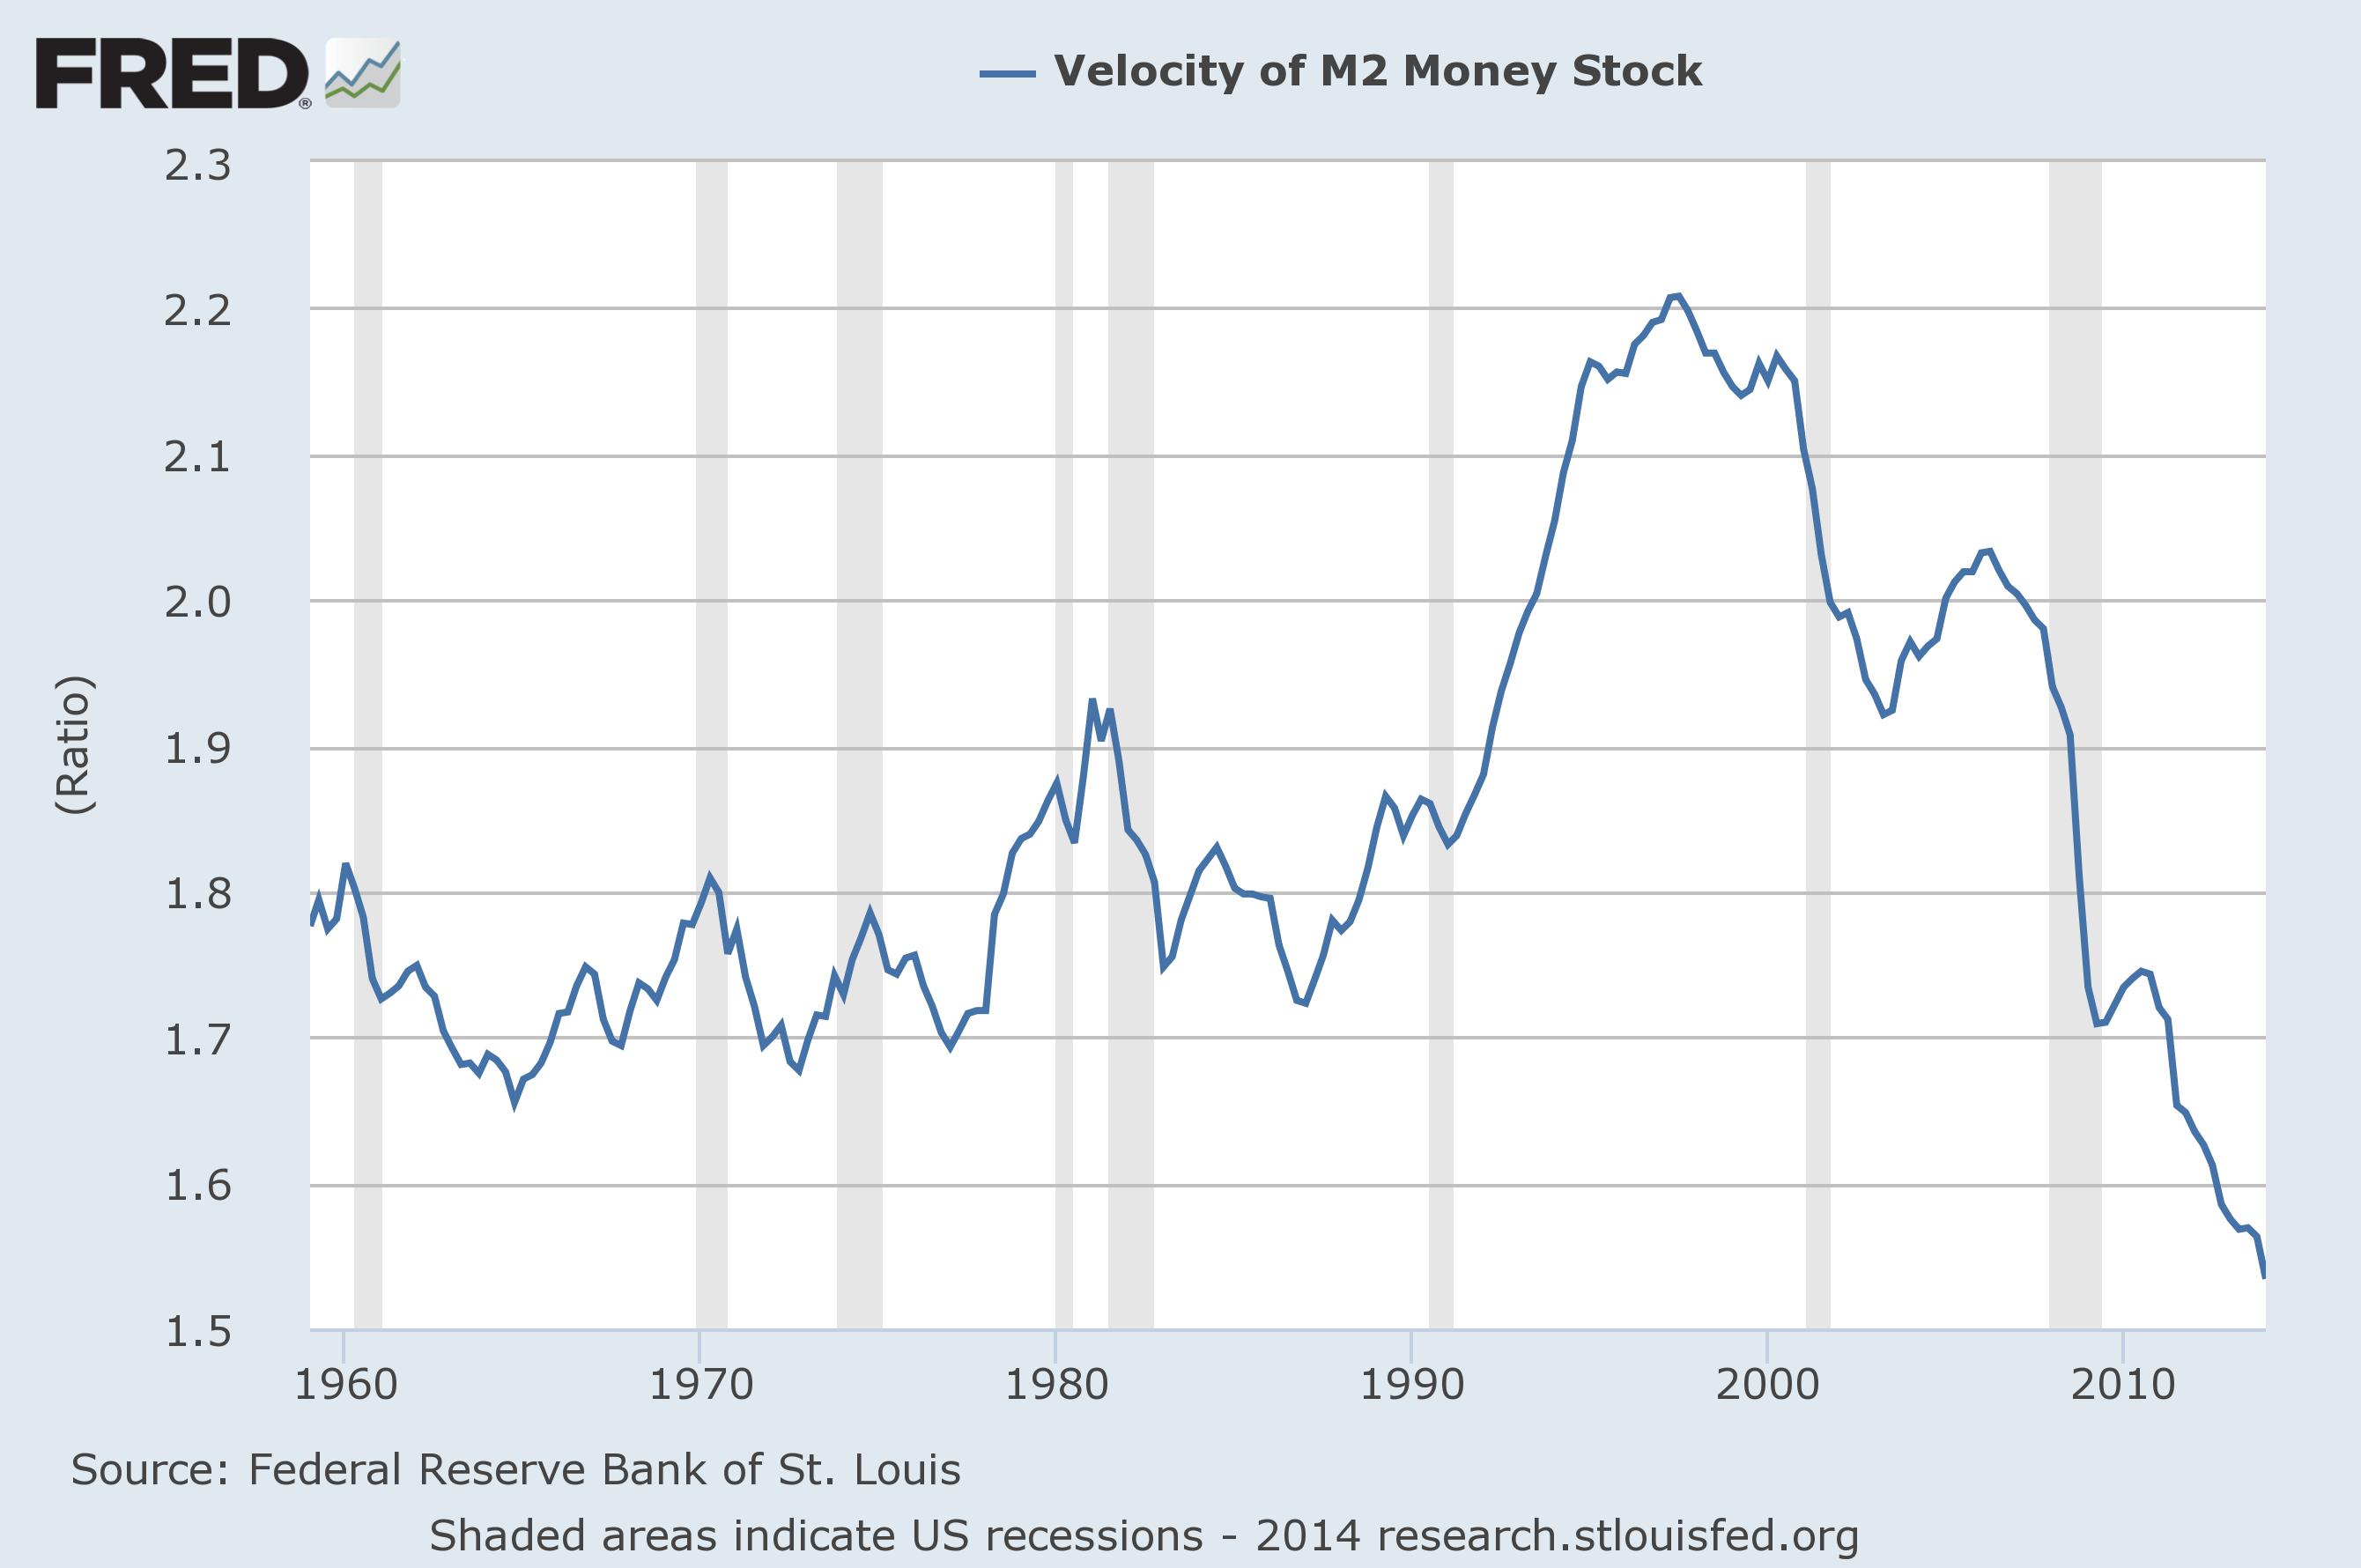
One approach to estimate the end of stimulus is GDP growth decline and another approach is to monitor the fall in M2 money velocity. Here, my projection for M2V to cross 0 is 2038 (24 years from now).

Wealth/wage gaps will continue to widen especially after recessions. Ironically, taxes can rise during this period but the trends will not change as no reform is entertained.
There are 2 limits to current policy BUT not asset prices/bubbles (since the 2012 Bernanke asset bubble/wealth effect speech).
Summary of current fiscal/monetary limits:
- Fiscal stimulus occurs after a recession and can scale to -12/-15% of GDP then it is dialed back with tax increases to appease bond market over the following years
- Monetary stimulus can continue until ccpi reaches 2.0
At this time (2014) fiscal stimulus has a lot of room to the upside. After a recession in 2016 (if ccpi reaches 2.0), fiscal will be scaled up again as so much capital will be available to government-see Japan case (1990-present). Japan is still going with massive fiscal stimulus and has no sign of stopping.
There was no recession in 2012 as many predicted because inflation fell. Monetary stimulus is continuing as ccpi has remained below 2.0 since Sep/Oct 2012 and Feb 2013. Most likely this will continue through 2015 as inflation (ccpi) remains tame. Eventually asset prices will rise enough to create some inflation as seen in ccpi. We just don’t know when. I will watch and report on this. 2016 is the most likely possibility due to it being an election year- see previous recessions 1992, 2000, and 2008. Inflation at 2.0 or greater is a necessary condition however.
“The Fed can keep spending as long as inflation stays low, hoping that eventually there will be a strong economic rebound.” Spitznagel
Impact of Debt
PQ = MV = GDP

Debt feeds into prices and sustains high prices if it is not written off. This leads to reduced real economic growth (Q) and falling money velocity. High prices lead to reduced money velocity! This observation seems obvious to most people. The turnover of high priced houses is much lower than mid-priced houses.
Low inflation (and low economic growth) leads the Fed to simply push harder on M (Money Supply) to drive economic growth. Tricklism is easier than structural reform.