HA candles are now available on stock charts so trading view is no longer needed…
From Stock charts…definition of HA candles-
Heikin-Ashi Candlesticks are an offshoot from Japanese candlesticks. Heikin-Ashi Candlesticks use the open-close data from the prior period and the open-high-low-close data from the current period to create a combo candlestick. The resulting candlestick filters out some noise in an effort to better capture the trend. In Japanese, Heikin means “average” and “ashi” means “pace” (EUDict.com). Taken together, Heikin-Ashi represents the average-pace of prices. Heikin-Ashi Candlesticks are not used like normal candlesticks. ….Instead, these candlesticks can be used to identify trending periods, potential reversal points and classic technical analysis patterns.
So in summary only 2 indicators on/just after Fed meetings this year until taper ends in October. I anticipate a large correction of 10-15% in November just after taper ends. The Fed knows QE has diminishing returns and hence they need to taper to ‘reload’ for the next round.
1) VIX 12dma
2) Daily HA $0.80+ is green (GHA) at close or at open the next day. If up on Fed day, buy at open following day OR buy the 1st GHA at close if down for days following Fed meeting. Decision day is the following day from a Fed meeting.
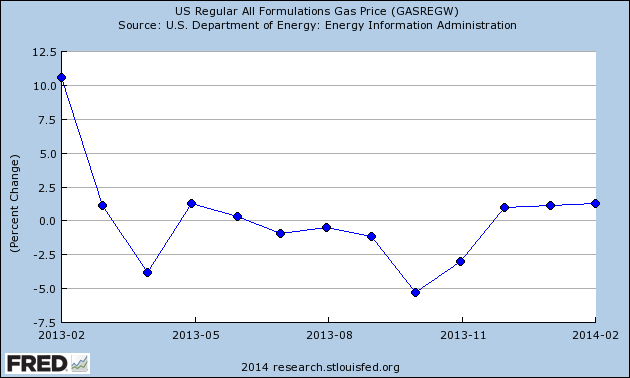
The next period is Mar 20-28 for trading…cash for now. CCPI fell again to a recent low. GCPI will also be weak this month as gas inflation is weak again for Feb compared to last year.
TLT may have a run BUT with ccpi at 1.6 (lowest since 2011) and gcpi at 1.6 AND gas inflation low for february, it’s not a good risk at this time. Rather the uptick in TLT indicates a fall in SPY and another nice rebound coming. With inflation this low, a nice SPY rebound is coming again.
See gas inflation here which indicates feb cpi to be weak as well. Feb gas inflation last year was much stronger. Economy is weak and we have continued taper until October which will make for a volatile up/down SPY.