TLT:$USD shows the best relationship for transitions of TLT bull/bear…
http://stockcharts.com/h-sc/ui?s=TLT%3A%24USD&p=W&yr=3&mn=0&dy=0&id=p29065458250
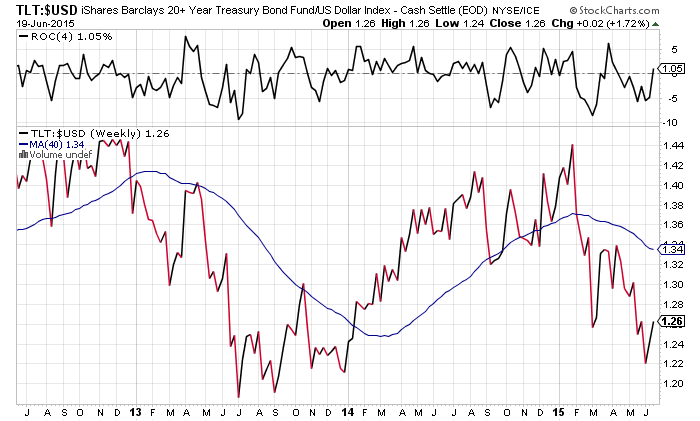
You clearly see 2013…QE
2014…Taper
2015 Jan No QE
2015 Feb-on below line waiting for new environment/regime
Also VIX weekly has been added to Reference section. It shows VIX rising for 4 weeks. It may rise for another week then drop again in July.

Also interesting TLT to FXE…
http://stockcharts.com/h-sc/ui?s=TLT%3AFXE&p=W&yr=3&mn=0&dy=0&id=p20630589853

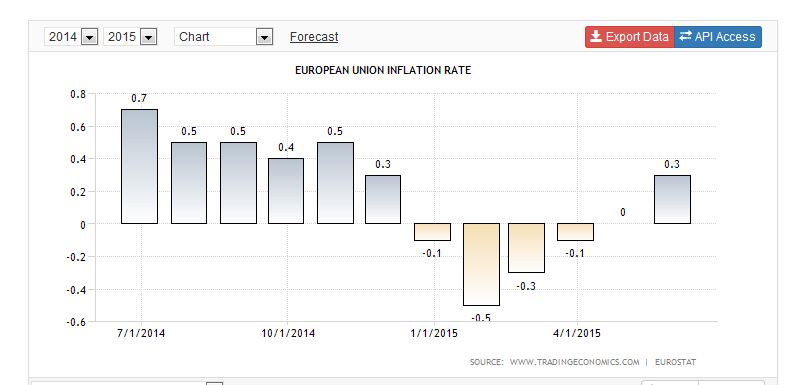
And eurozone inflation bounces back so Euro should rise for a while…
http://www.tradingeconomics.com/euro-area/inflation-cpi