- Inflation rises
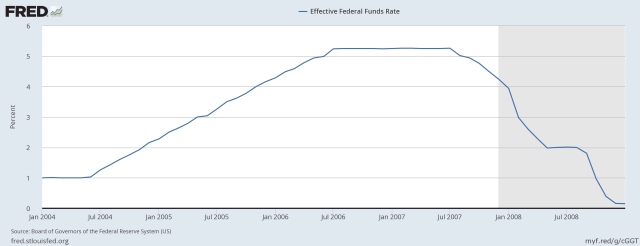
- Fed raises rates (2005-Jul 2006)
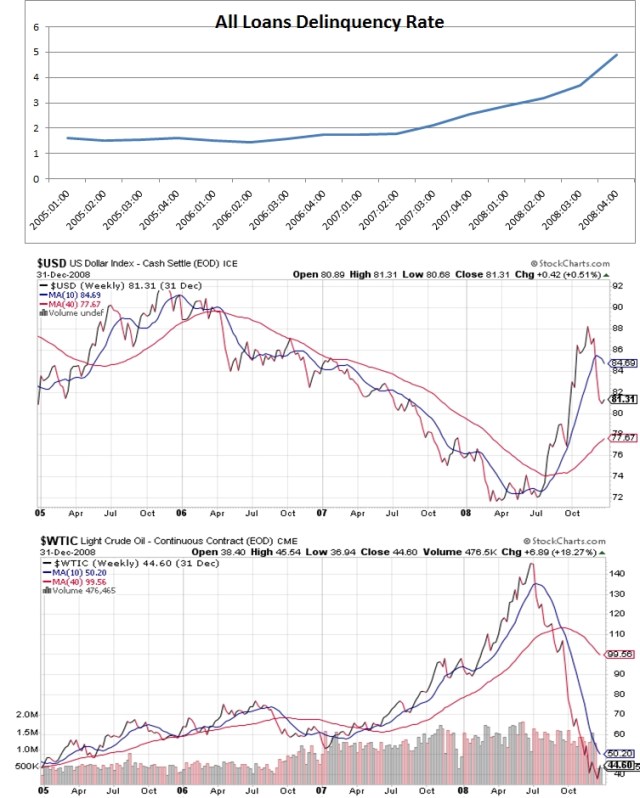
- Highly indebted delinquencies start to rise (2006-2008)
- A breaking point arrives and Fed starts to drop rates RAPIDLY (Sep 2007-Dec 2008)
- USD falls rapidly (2007-Jul 2008)
- Oil and commodity prices spike ($70-$150) causing a recession and economic contraction (Jul 2007-Jul 2008)
- Spiking oil prices lead to a deflationary collapse (Jul 2008-Dec 2008)
- USD rises in response to deflationary collapse (Jul 2008)
- QE follows as a form of monetary stimulus and USD starts to fall again (Jan 2009)
Notice how slowly Fed raises rates from 2004 (3.5 years) and how fast they fall from Sep 2007-Dec 2008 (1.25y)!
From 2005-2008:

Or easier to see the Y/Y change in delinquency rates:

Also VIX rose through 2007

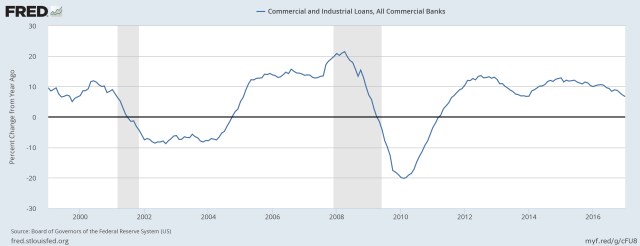
Another related measure, check commercial and industrial loan growth for the last 3 recessions to see the effect of credit contraction or merely slowing:
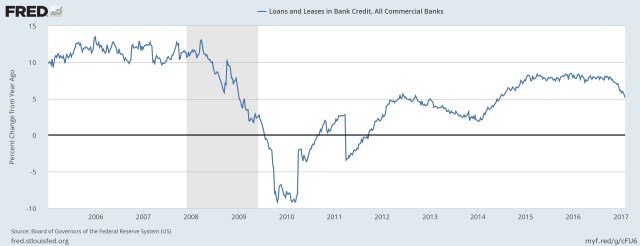
Or all loans and leases from 2005-2017: