
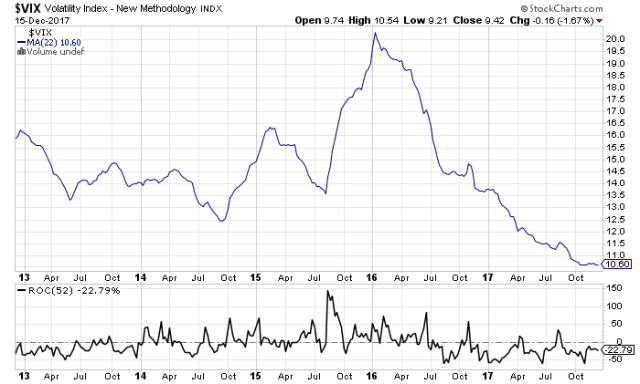
Good news is that it has bottomed out and has nowhere to go but up!
ROC shows above the line Jan 2014-Jul 2016. And from Jul 2016 below the line. 10.60 is also at the bottom historically.
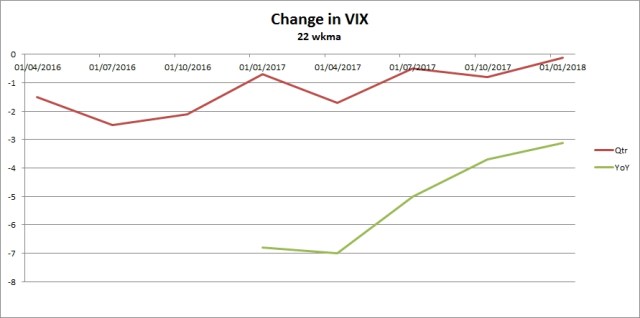
The change in VIX below shows VIX turn coming:
Link on the web site:
http://stockcharts.com/h-sc/ui?s=%24VIX&p=W&b=5&g=0&id=p29296422935
Inflation below 2.0:
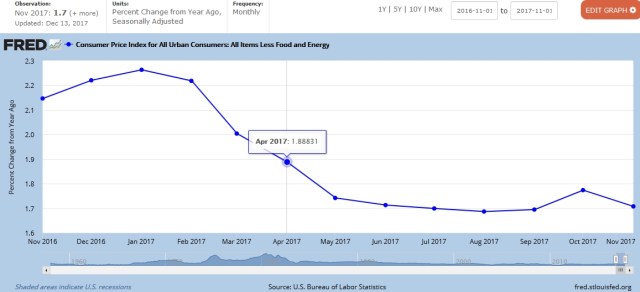
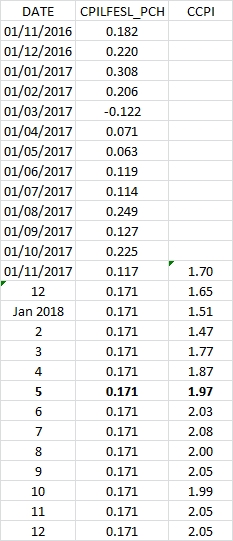
Inflation fell in Apr so SPY got an extra boost through December. BUT next year ccpi reaches 2.0 by Jun fed meeting as I created a spreadsheet to show
(assuming 0.171 monthly inflation, average of the last 2 mo):
On Nov 28, the Fed said low inflation is transitory…
Also as oil starts to fall in Feb, ccpi will start to get an uplift. CCPI 2.0 by June means market will be afraid of more rises to come and hence react. Years with ccpi 2.0 have at least two vix 20 events and have lower returns. Generally, the higher the inflation the worse the performance of SPY. CCPI 2.0 by June does not favor TLT however (after that point).
Problems for SPY 2018:
- Transition to ccpi 2.0 by Jun
- Oil rolls over in Feb bottoming in Jan 2019
- Non-surge year …reversion to mean reduces return 8-10%
- Vix very low 2017 means a rising vix for 2018
- TLT:Oil returned to risk off Dec 2017 (early)
- Zero VIX 20 events in 2017 means reversion to mean of 2 events per year
SPY 2019:
- Aggressive Fed in 2018 means Fed on pause. (total of 8 rises over 3y)
- Fed on pause means no fast rebounds. Low return years also have slow rebounds (2011,2015 & 2007).
- SPY return of 1-2% only (reversion to mean of SPY returns)
- TLT return improves as Fed on pause
- UC YoY start to rise
- Delinquencies (for all loans) YoY start to rise
- Oil starts to rise in Feb as USD weakens due to Fed on pause
- Rising Vix
- No good plays after Jan/Feb… stay in cash and wait for 2020 (except for long oil/gold).
- Fed drops rates Dec 2019 (signals a recession)
