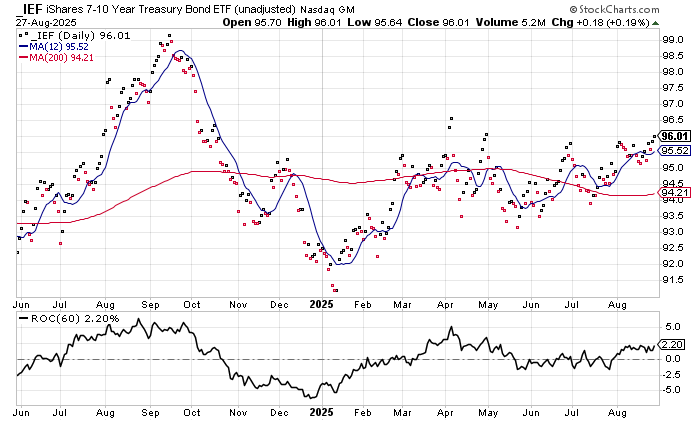
above 200dma and last high in aug…
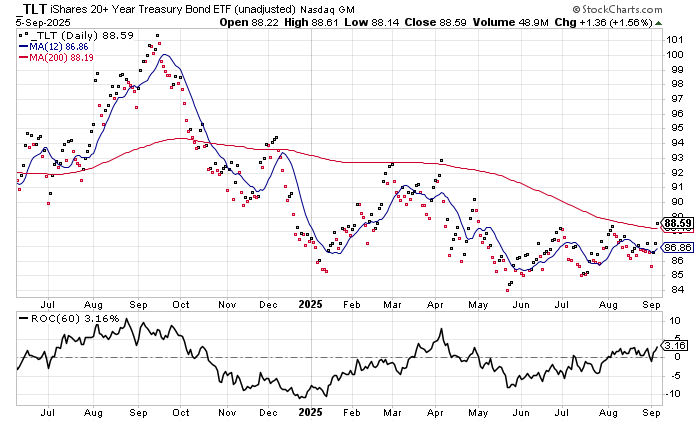

above 200dma and last high in aug…
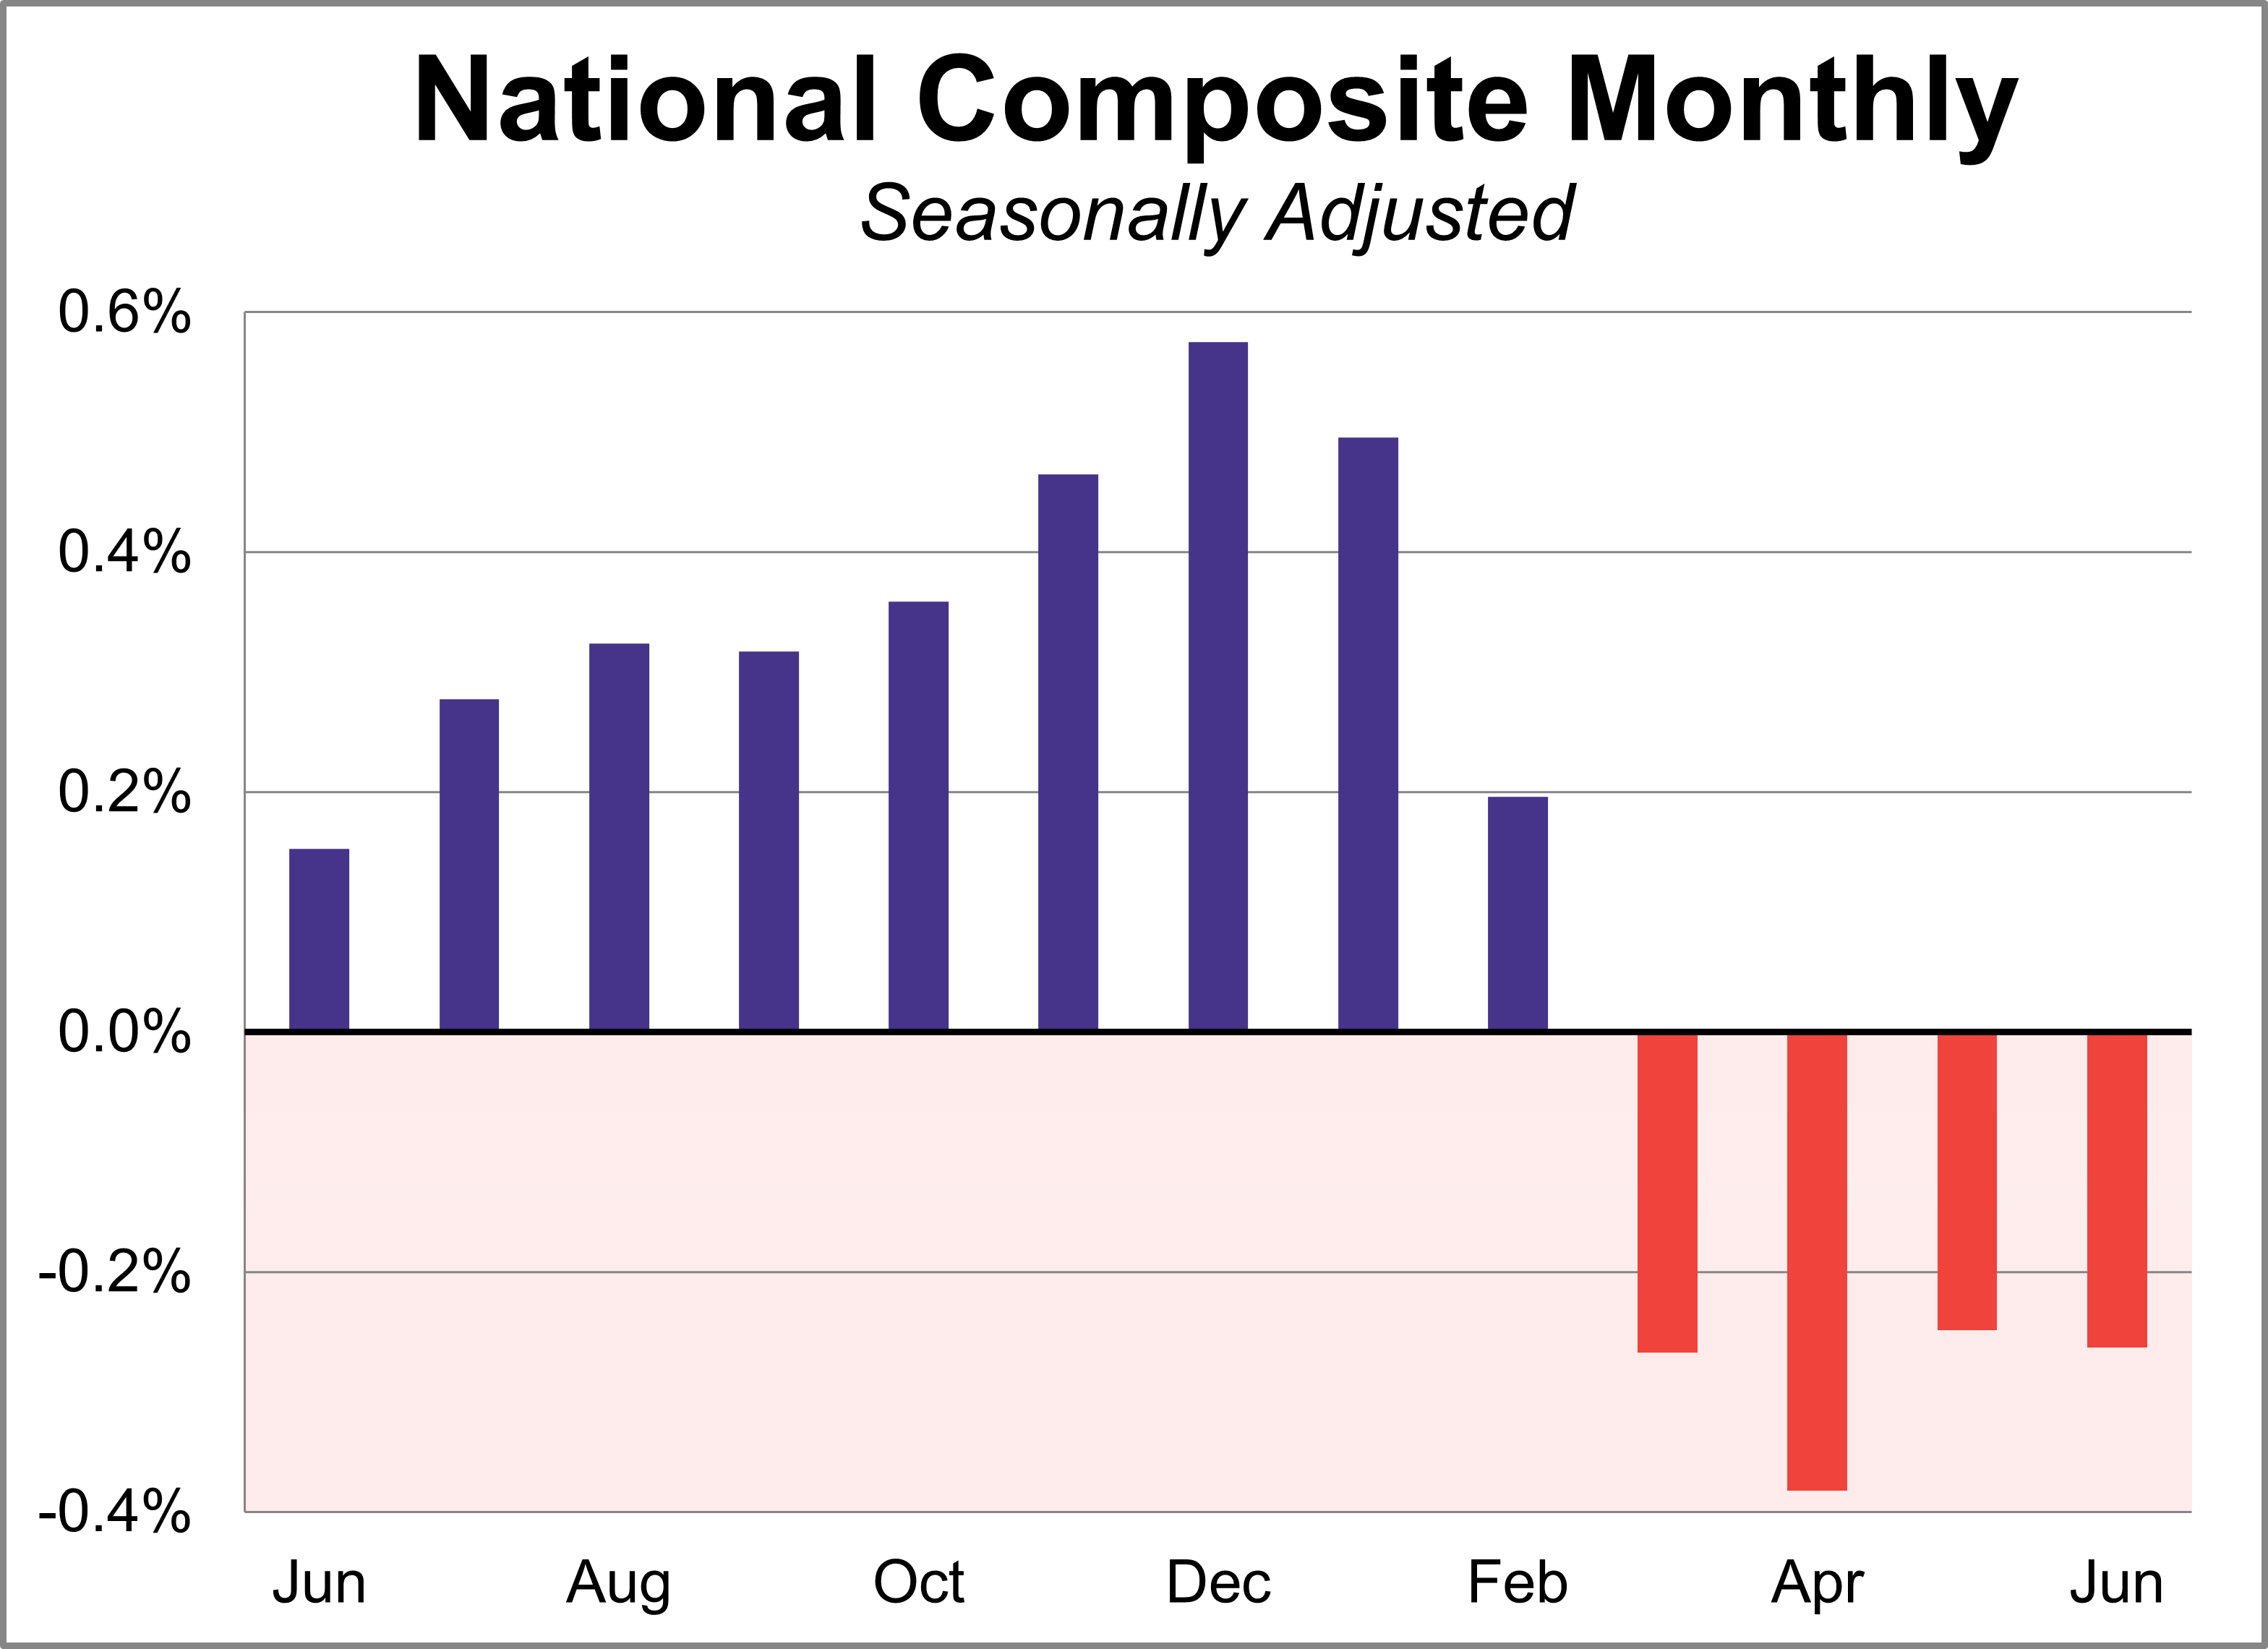
Case-shiller 4 months straight…
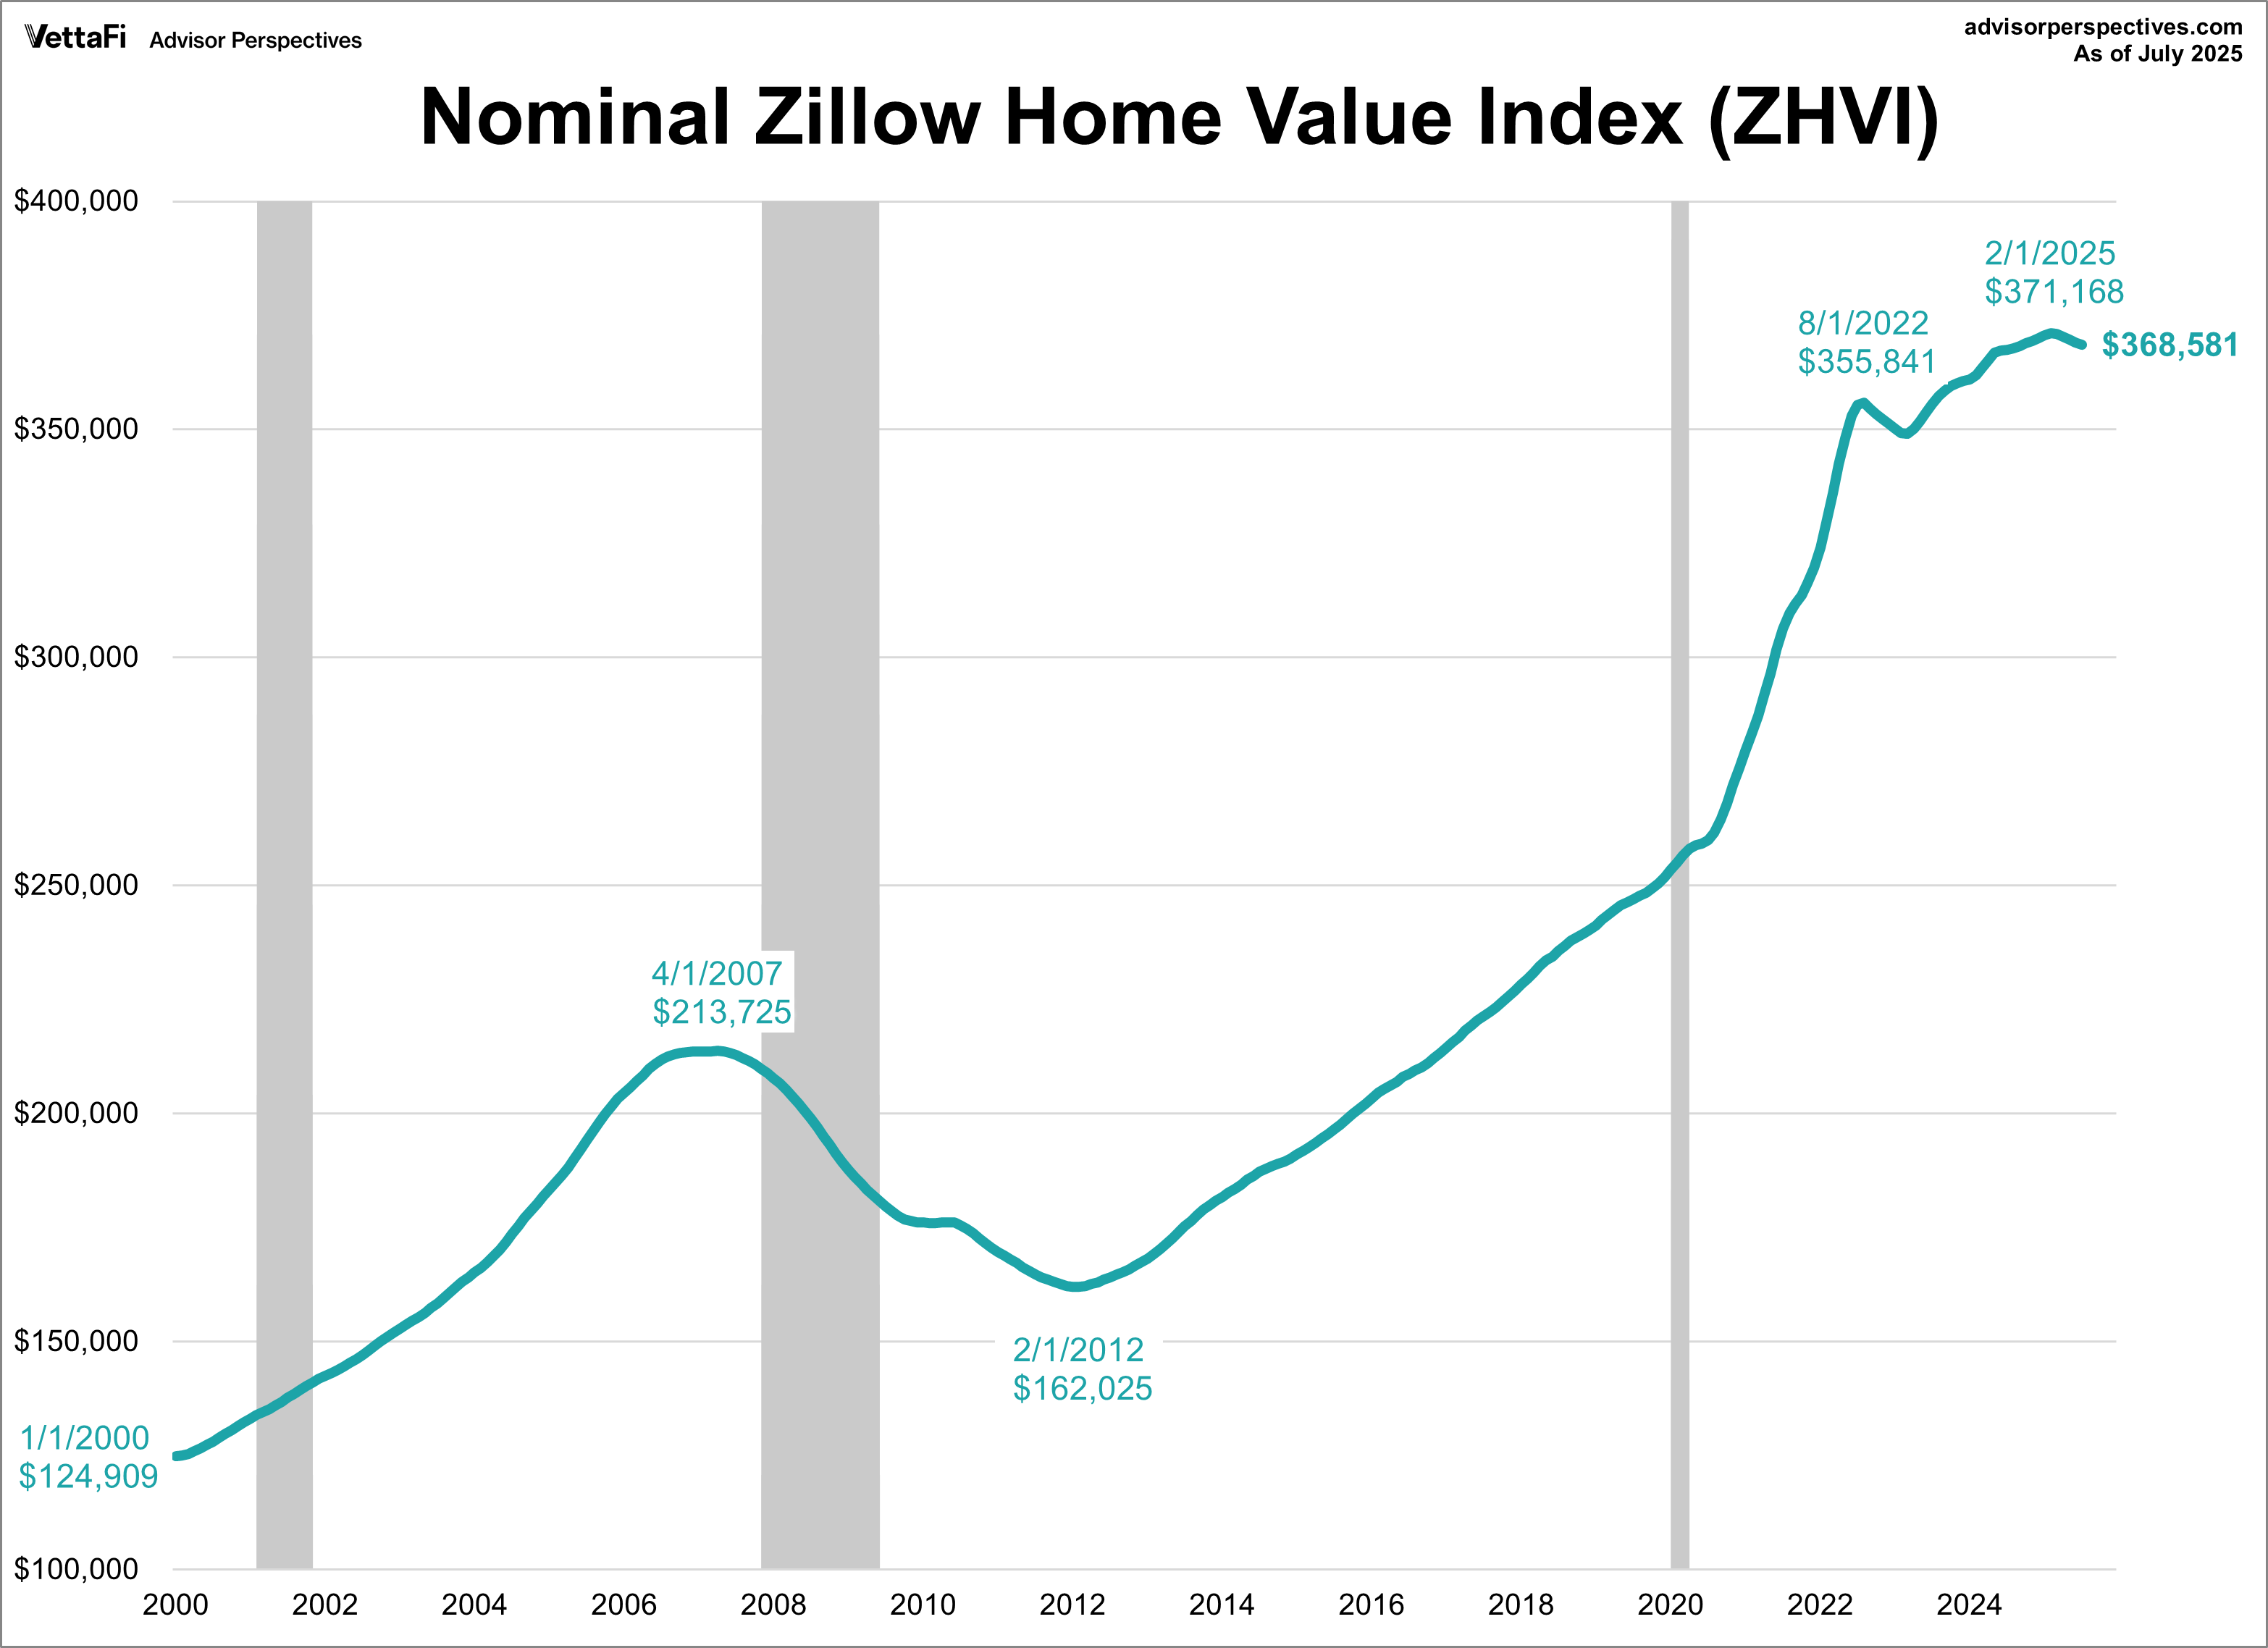
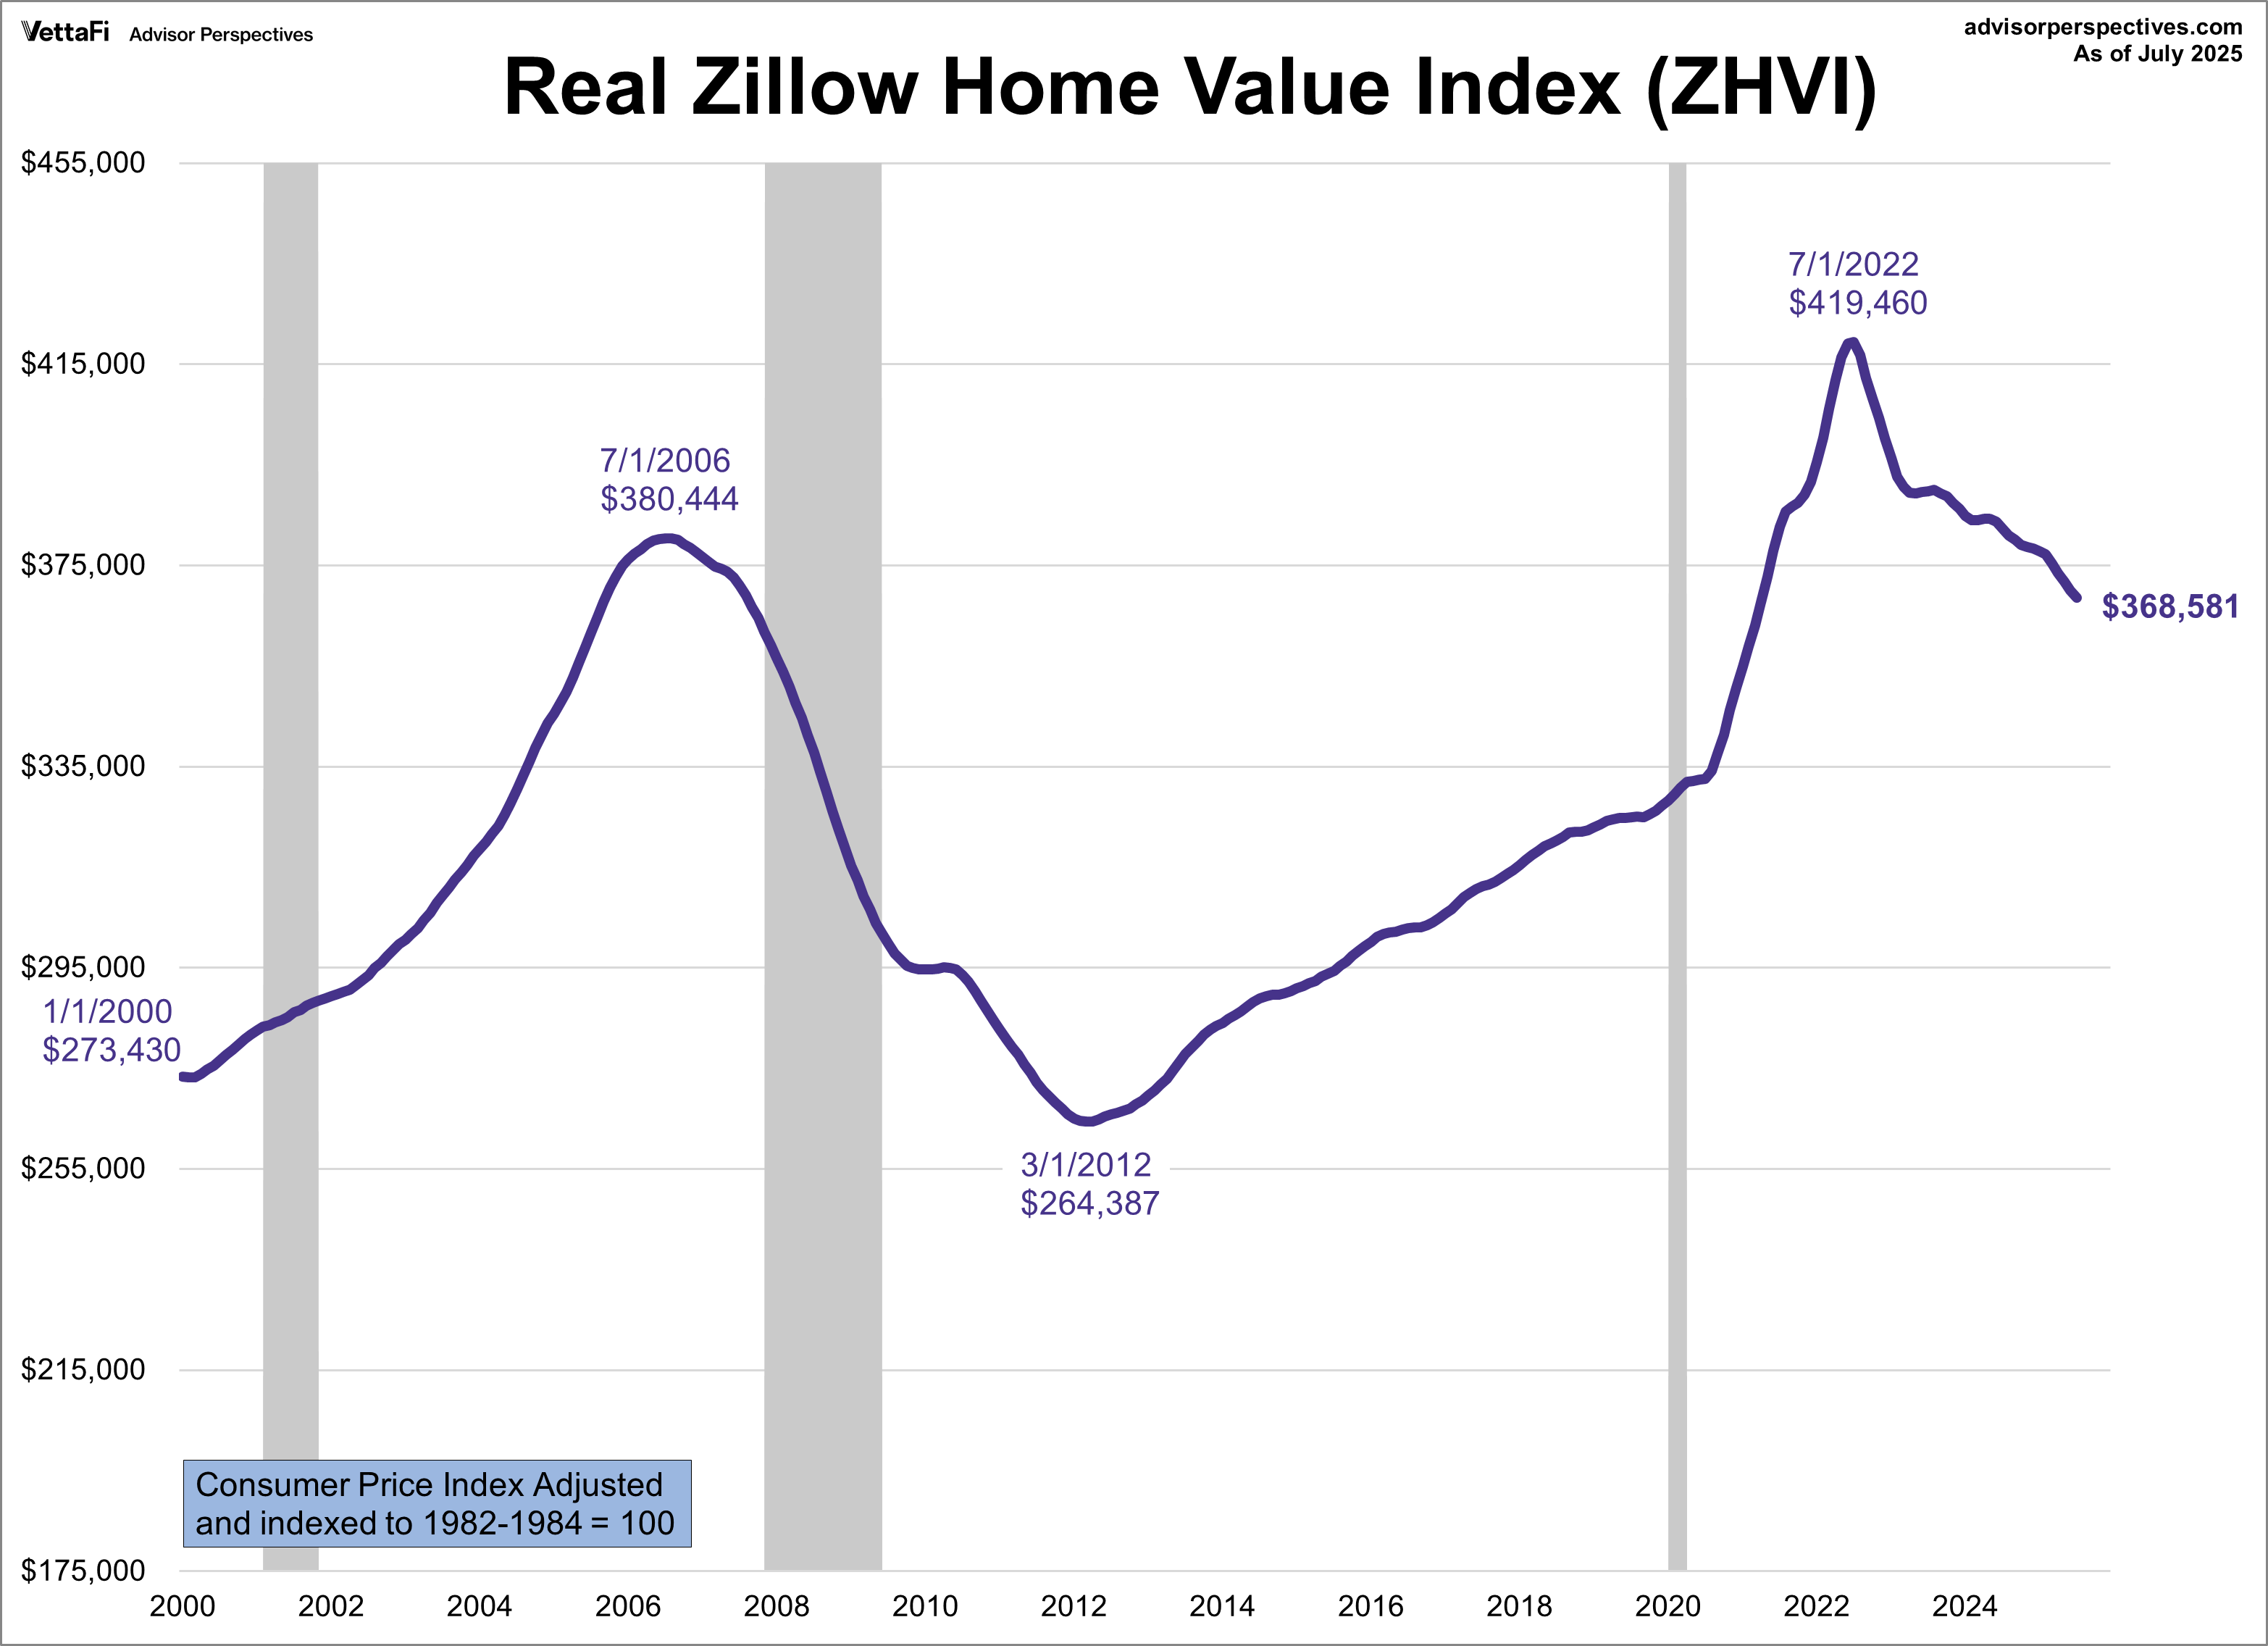
AND zillow confirms since March…
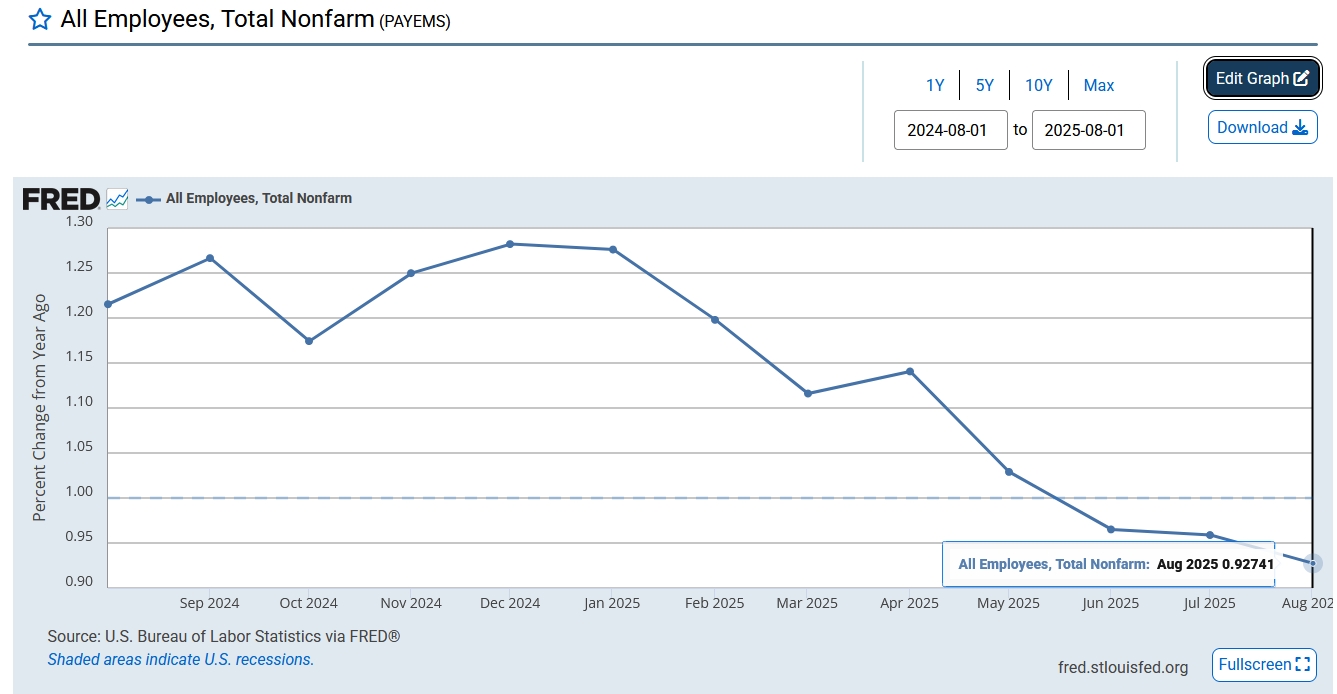
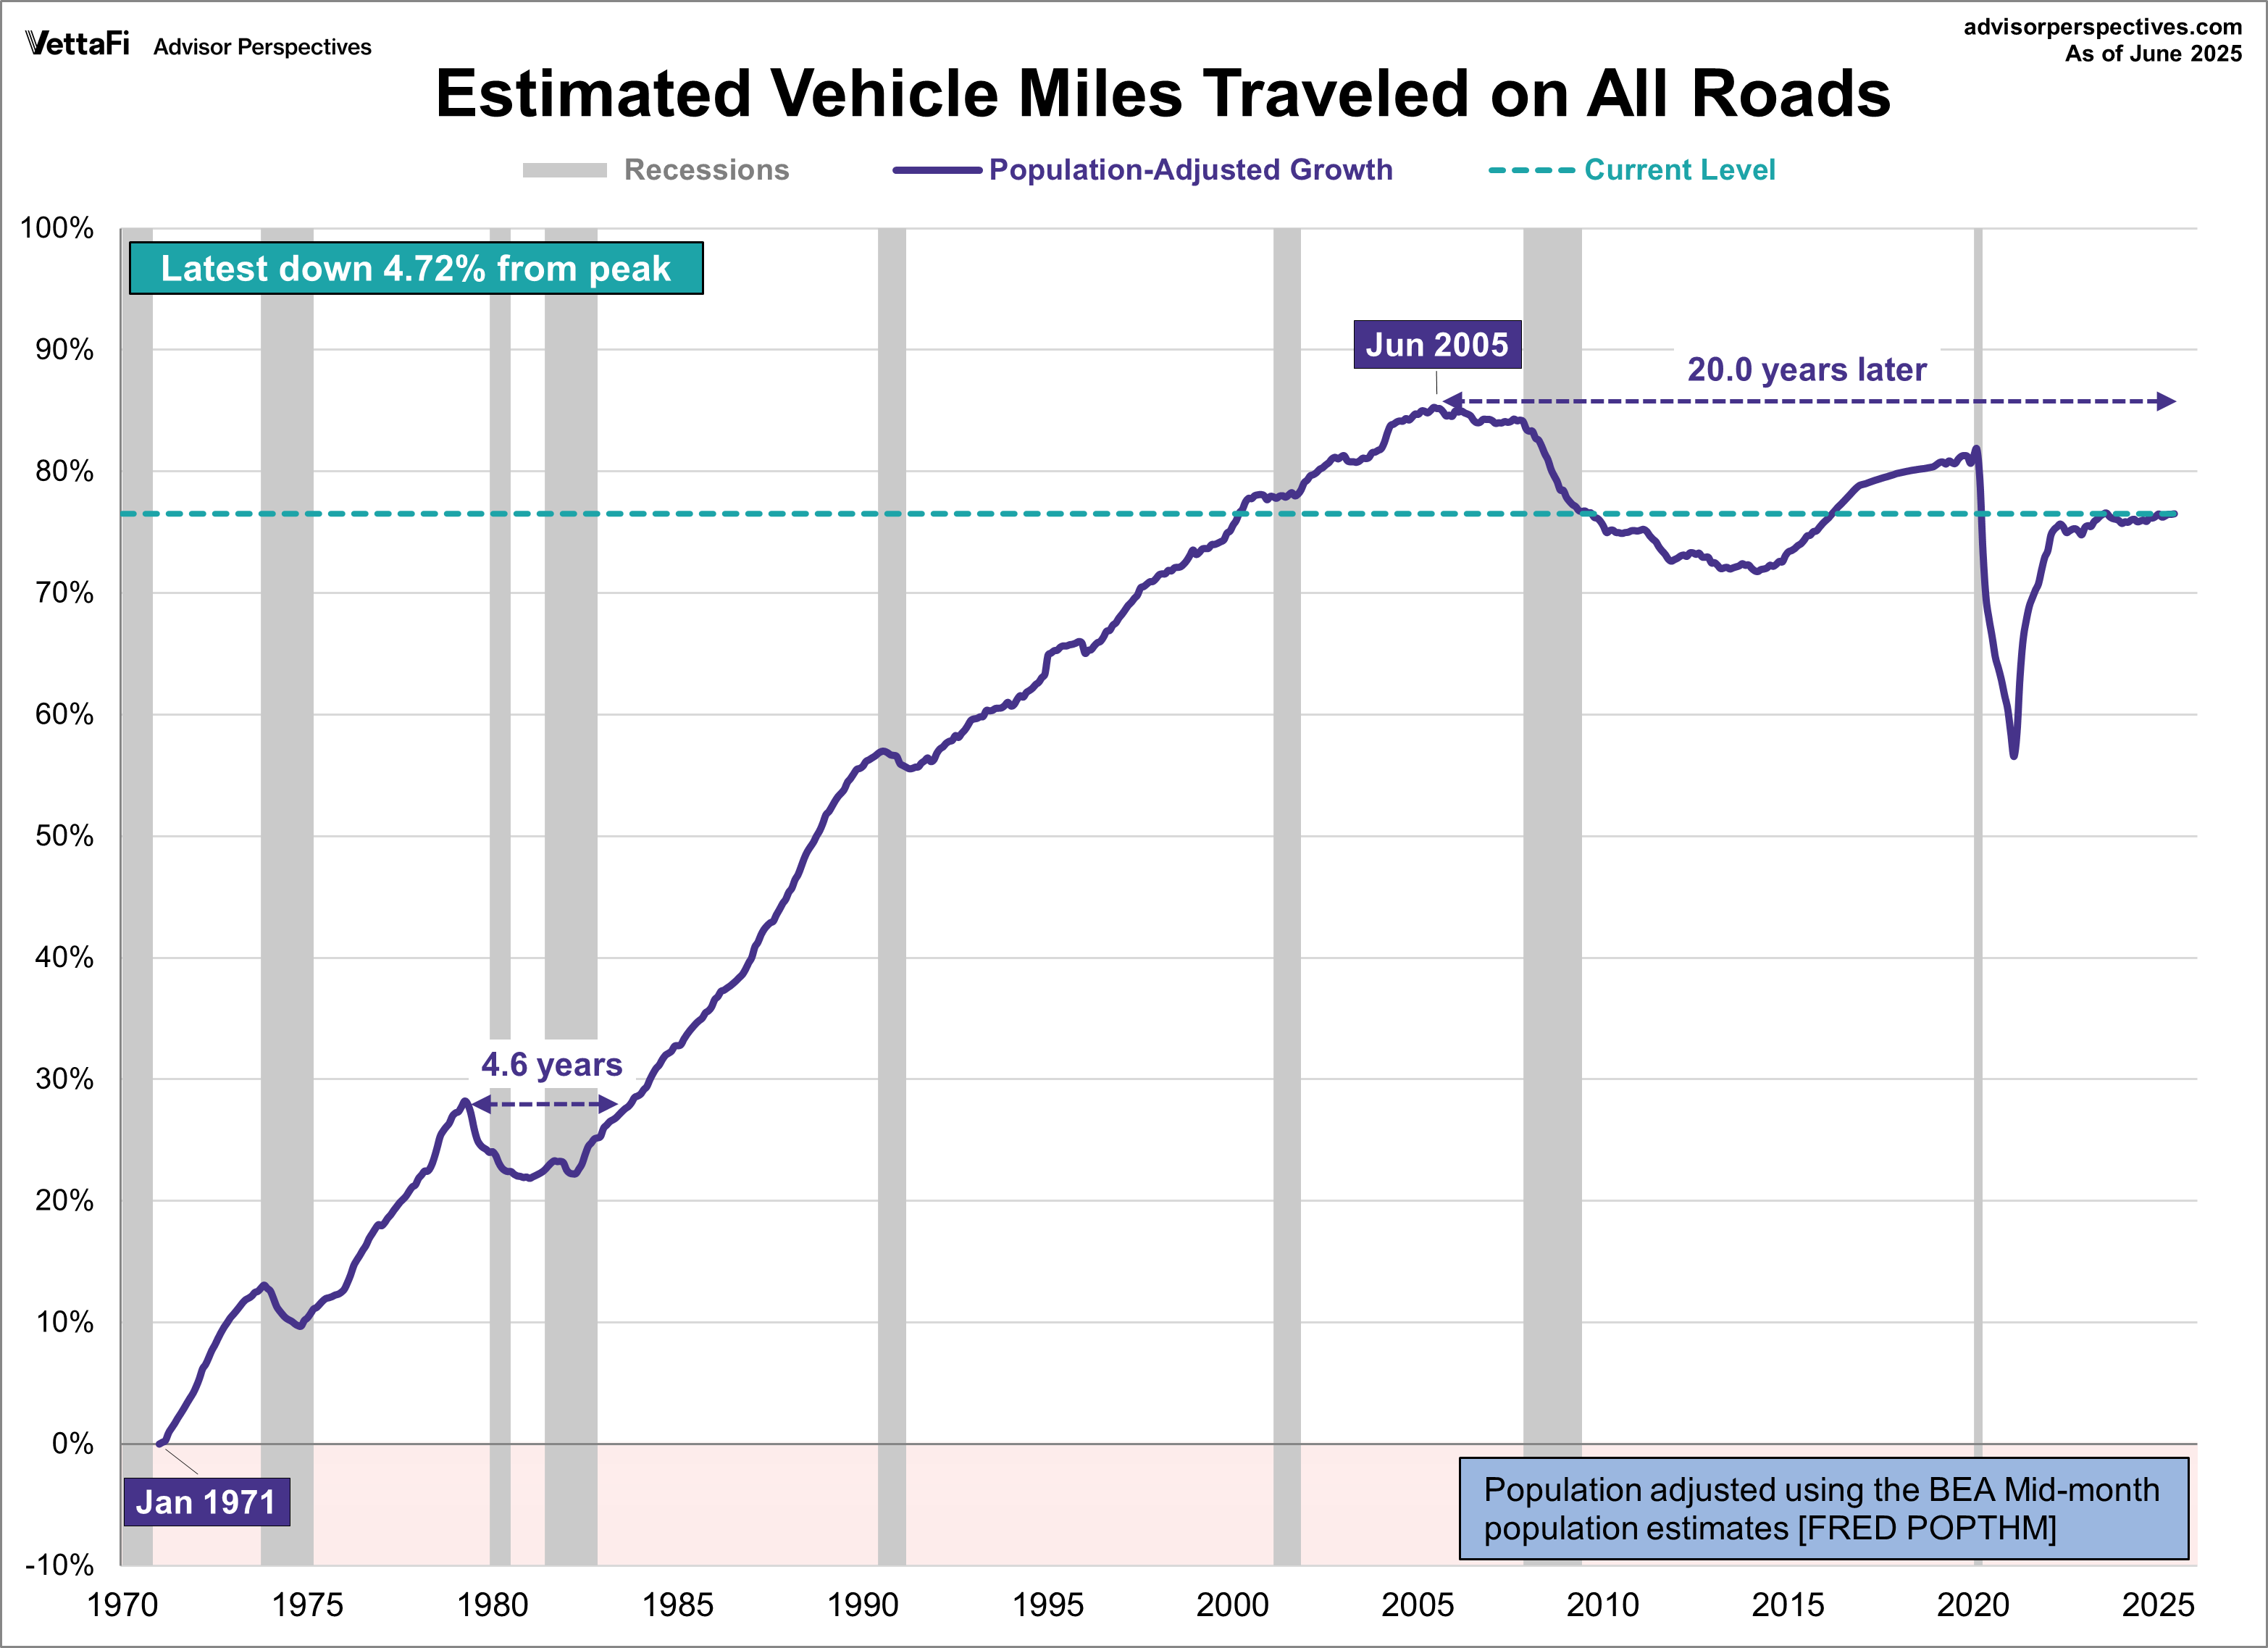
AND aside ….miles traveled as proxy for declining GDP per capita…
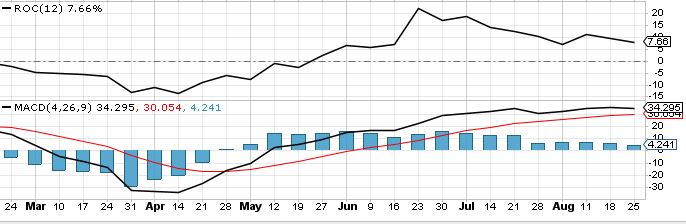
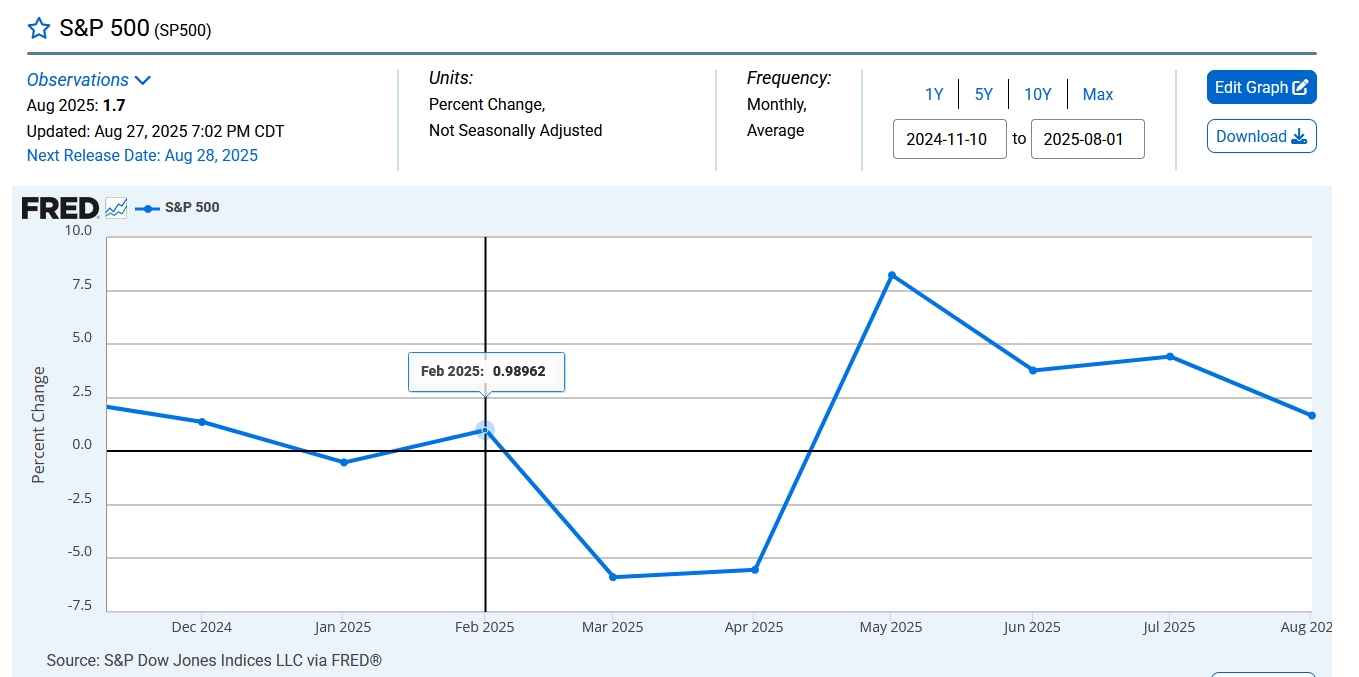
Despite rates being dropped, spy continues to lose upward momentum…
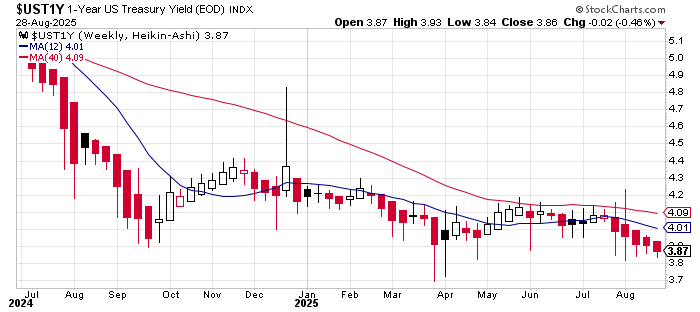
1 and 2 y Treasuries suck away money from SPY and then it hiccups.
The last 5 weeks of 1 year Treasuries show money being drawn away from SPY
and is the best leading indicator.
5 RHA bars on 1 year Treasury corresponds to declining momentum on SPY as seen in flat macd bars
and bi-wkly average prices losing momentum.

Above chart more clear but below 6mo SPY wkly macd (4wk) also shows it…
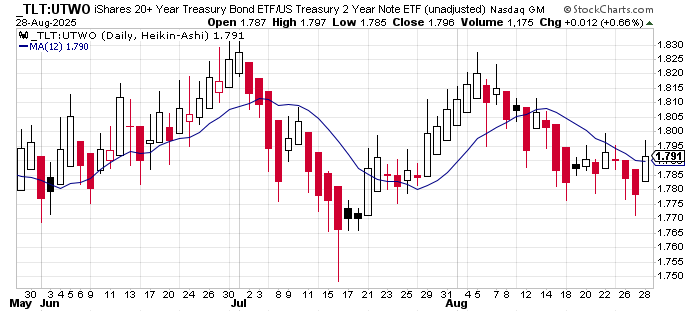
AND the same for TLT:SPY near a cross…

Downtrend in 1y Treasury in July last year showed the hiccup in Jul-Aug and the same with Feb-Mar.
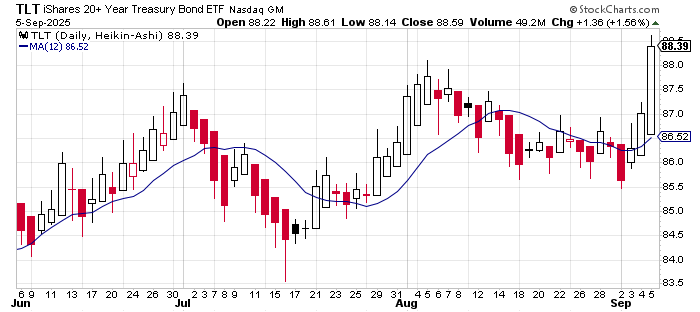
TLT moves up and will hit 91-92 by Fed meeting.
SPY will have trouble next week…
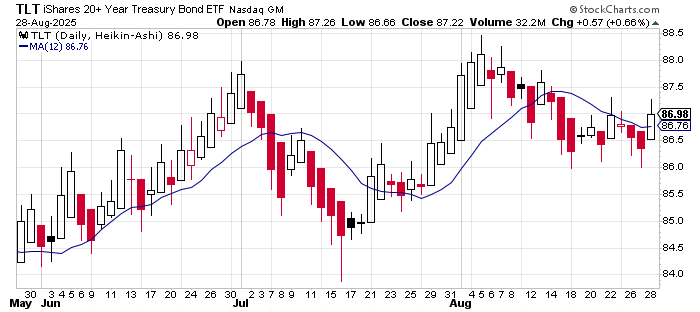
AND TLT gains on short bond
Oct-Nov for a big drop after Sep cools some more…
Big change from 4.1 to 3.84 the last 4 weeks…current FR is 4.3.

IT SEEMS NOW the 1 year is where it should be given a 0.25 drop. New FR will be 4.08.
200 dma points up again in August…
May-Jul weakness ends. SPY will start to have trouble.
In Feb, bonds started to move up ROC60 + and trouble happened in SPY Mar and Apr (Earnings’ Season).
When SPY has big trouble, it’s in earnings’ seasons.

IEF also up near breakout of 96.50

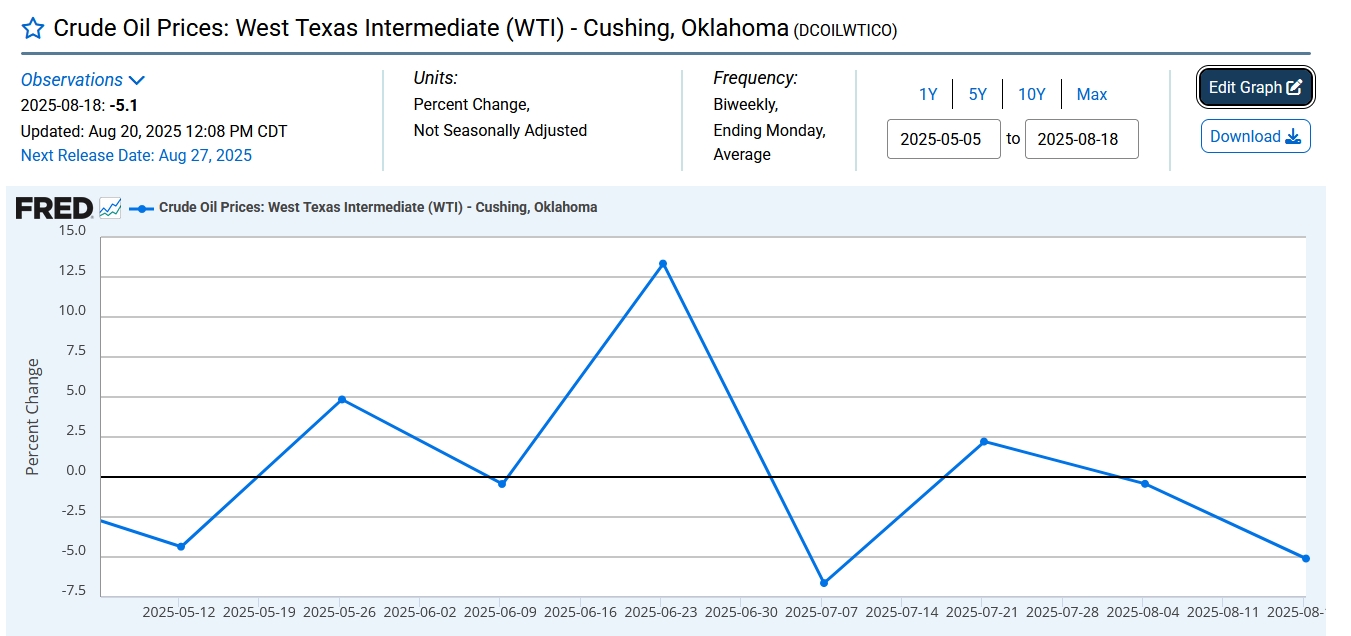
Bi-wkly is added after july monthly..

Bi-wkly oil drops 5%…
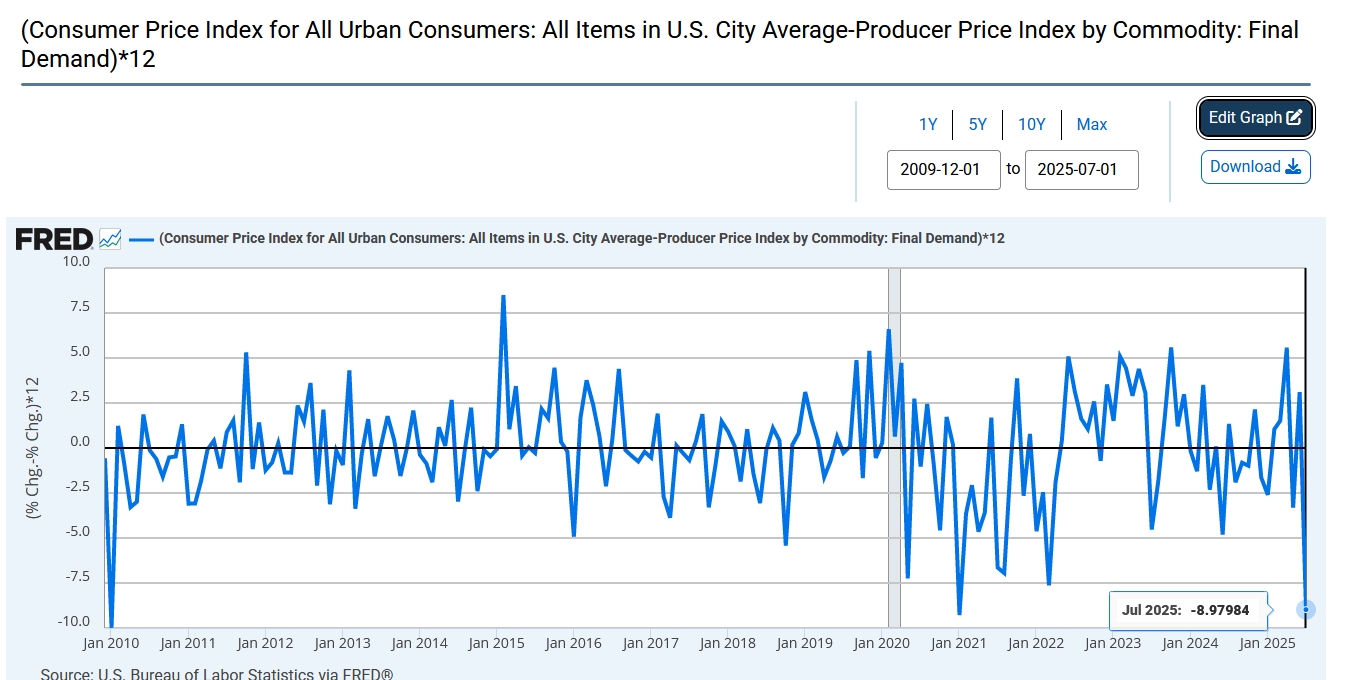
Starting Oct 2024 CPI was moving below PPI putting profits under pressure.
Profits were under pressure all during 2022 until Jan 2023 when profits soared
because CPI consumer prices were well above producer-wholesale prices.
NOTICE the CPI moves under PPI 1 year ahead of the S&P and vice-versa.
Jan 2017 it moves below and 2018 the stocks fall -20% OR
Jan 2021 it falls rapidly and 2022 the S&P falls -20% OR CPI-PPI rises rapidly during 2022
and S&P pops big in 2023.
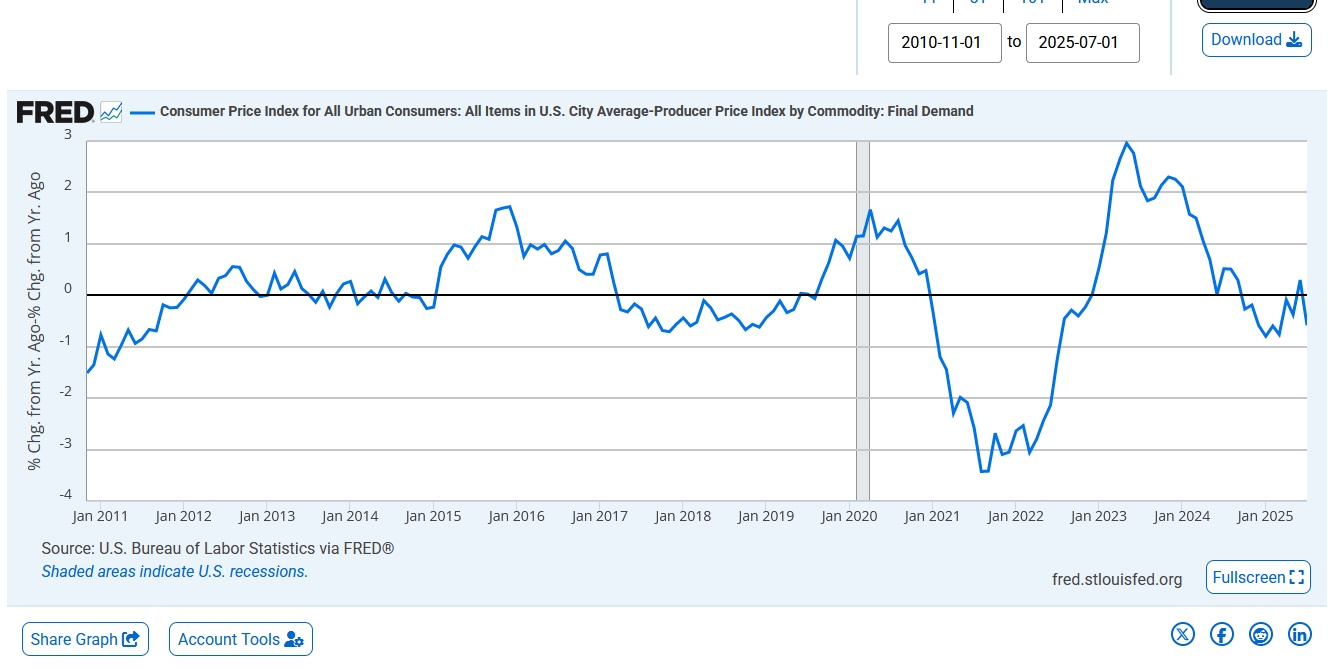
AND NOW monthly (annualized)