-
Recent Posts
Archives
-
Other Indicators
-
Longer Term

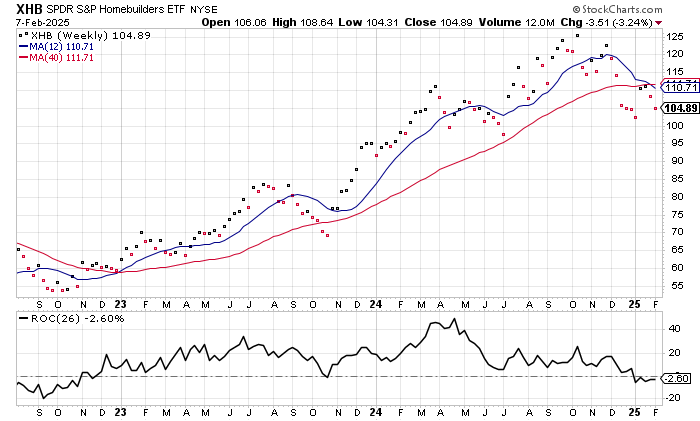
Lennar and DHI

DHI peaked in 2006 (homebuilders are leading indicators). Stocks had problems in 2007 and 2008.

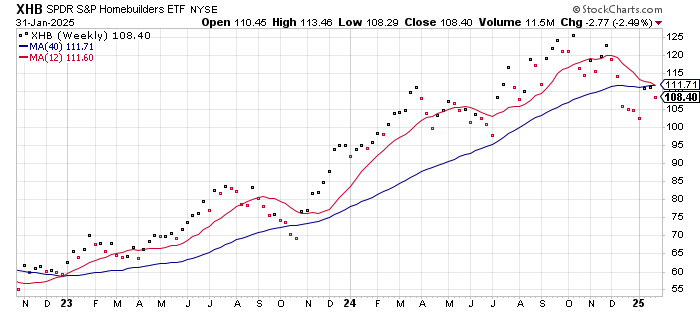
Housing stocks confirm downtrend 12 wk crossing the 40 week…1st time in 2 years..
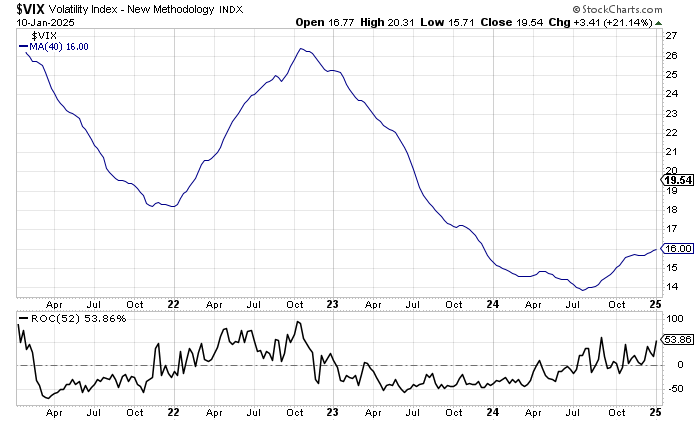
VIX still moving up…52 weeks +28%

https://str.com/press-release/us-hotel-results-week-ending-11-january
5-11 January 2025 (percentage change from comparable week in 2024):
https://www.hotelmanagement.net/operate/costar-us-hotels-report-slowest-adr-revpar-growth-4-years
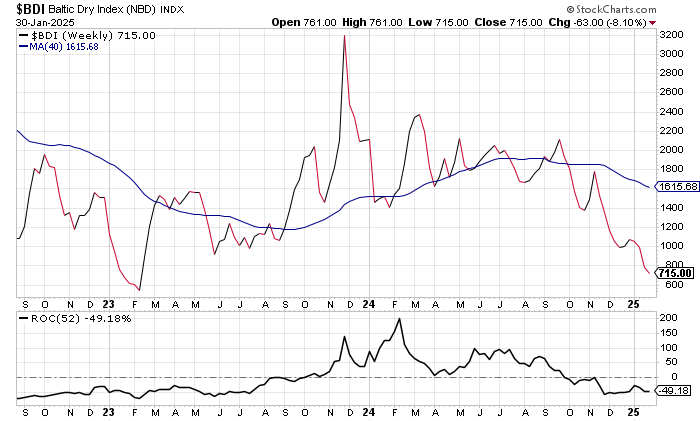
BDI in Jan 2024 +140%
BDI Jan 2025 -49%
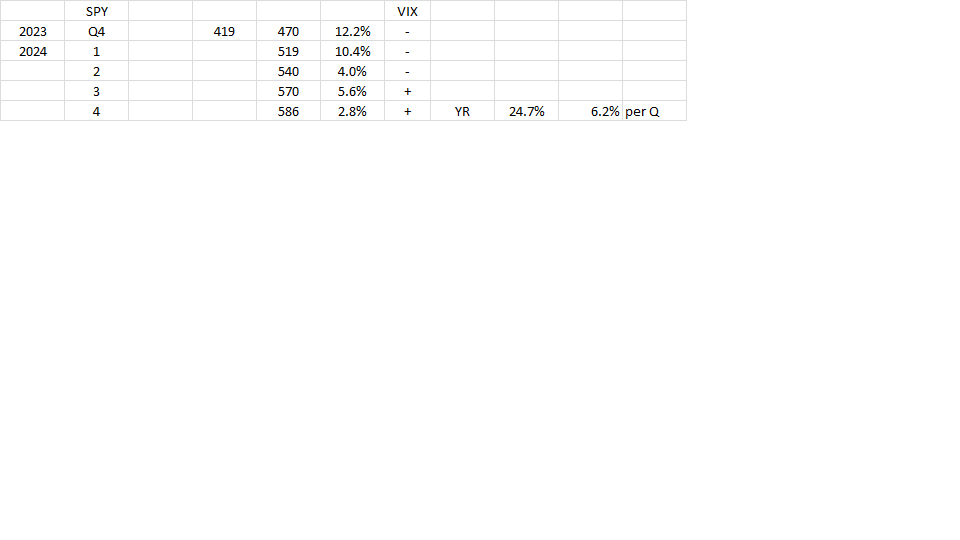
Economy weakening…even in last quarter Q4 2024
SPY quarterly slowdown…
Oil back down in Jan and
M1 money supply positive for 2024 and
OEX at end of year Q4 points to bear market…below 65 like 2021…Q4 critical to the following year…


Spending will start to suffer when markets start to gyrate 10%…
ABNB had a good 2023 and 2024. BUT NOW is in bear market for 6 months…future not so bright.

The base VIX and max VIX are shown in table below. By the end of the year base VIX will be 20.
And maximum will be VIX 30.

I have read that Inflated bubble stocks should be sold with a PEG of 3.0.
From investopedia…
The price/earnings to growth ratio (PEG ratio) is a stock’s price-to-earnings (P/E) ratio divided by the growth rate of its earnings for a specified time period.
The PEG ratio is used to determine a stock’s value while also factoring in the company’s expected earnings growth, and it is thought to provide a more complete picture than the more standard P/E ratio.
According to well-known investor Peter Lynch, a company’s P/E and expected growth should be equal, which denotes a fairly valued company and supports a PEG ratio of 1.0. When a company’s PEG exceeds 1.0, it’s considered overvalued while a stock with a PEG of less than 1.0 is considered undervalued.
PE ratio S and P 500 29.1
Shiller PE 37.3
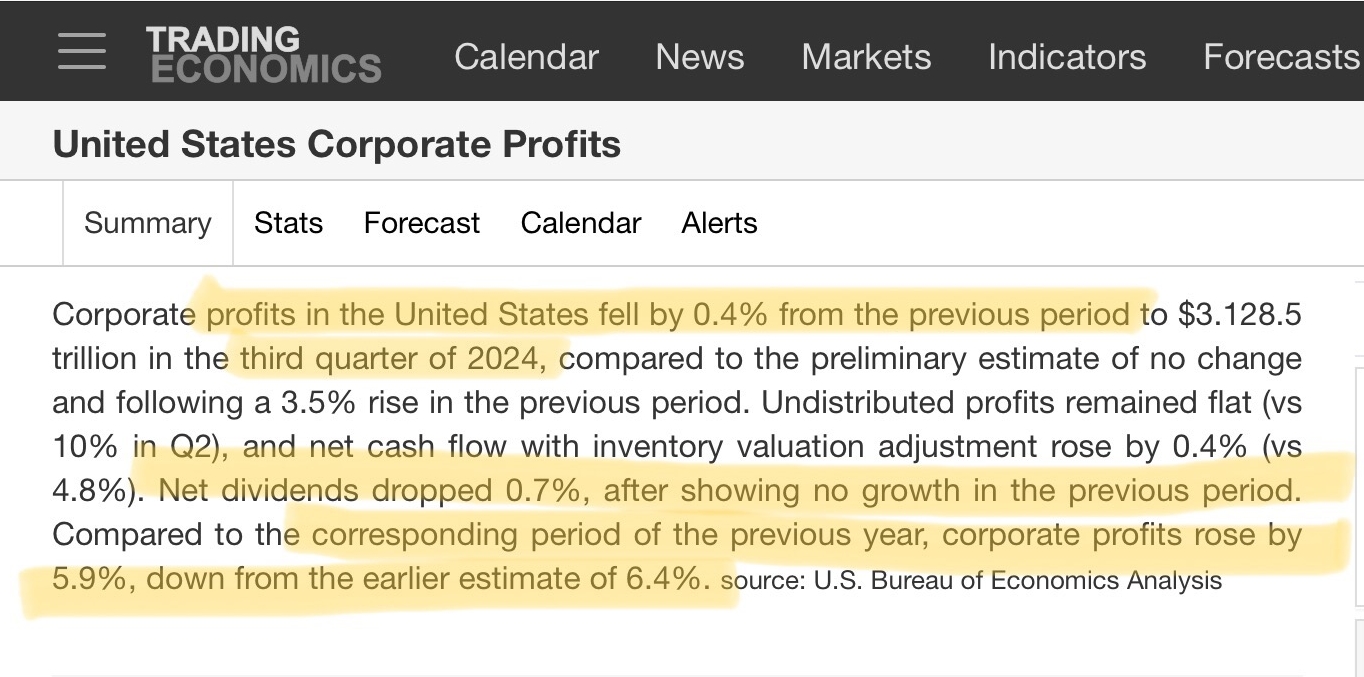
Earnings Growth 5.9%
PEG ratios
12mo PEG 4.93
Shiller PEG 6.3
Clearly market is worried now…VIX up 53% YoY..
Dividend growth now negative Q3 2024…more bad news for stocks…
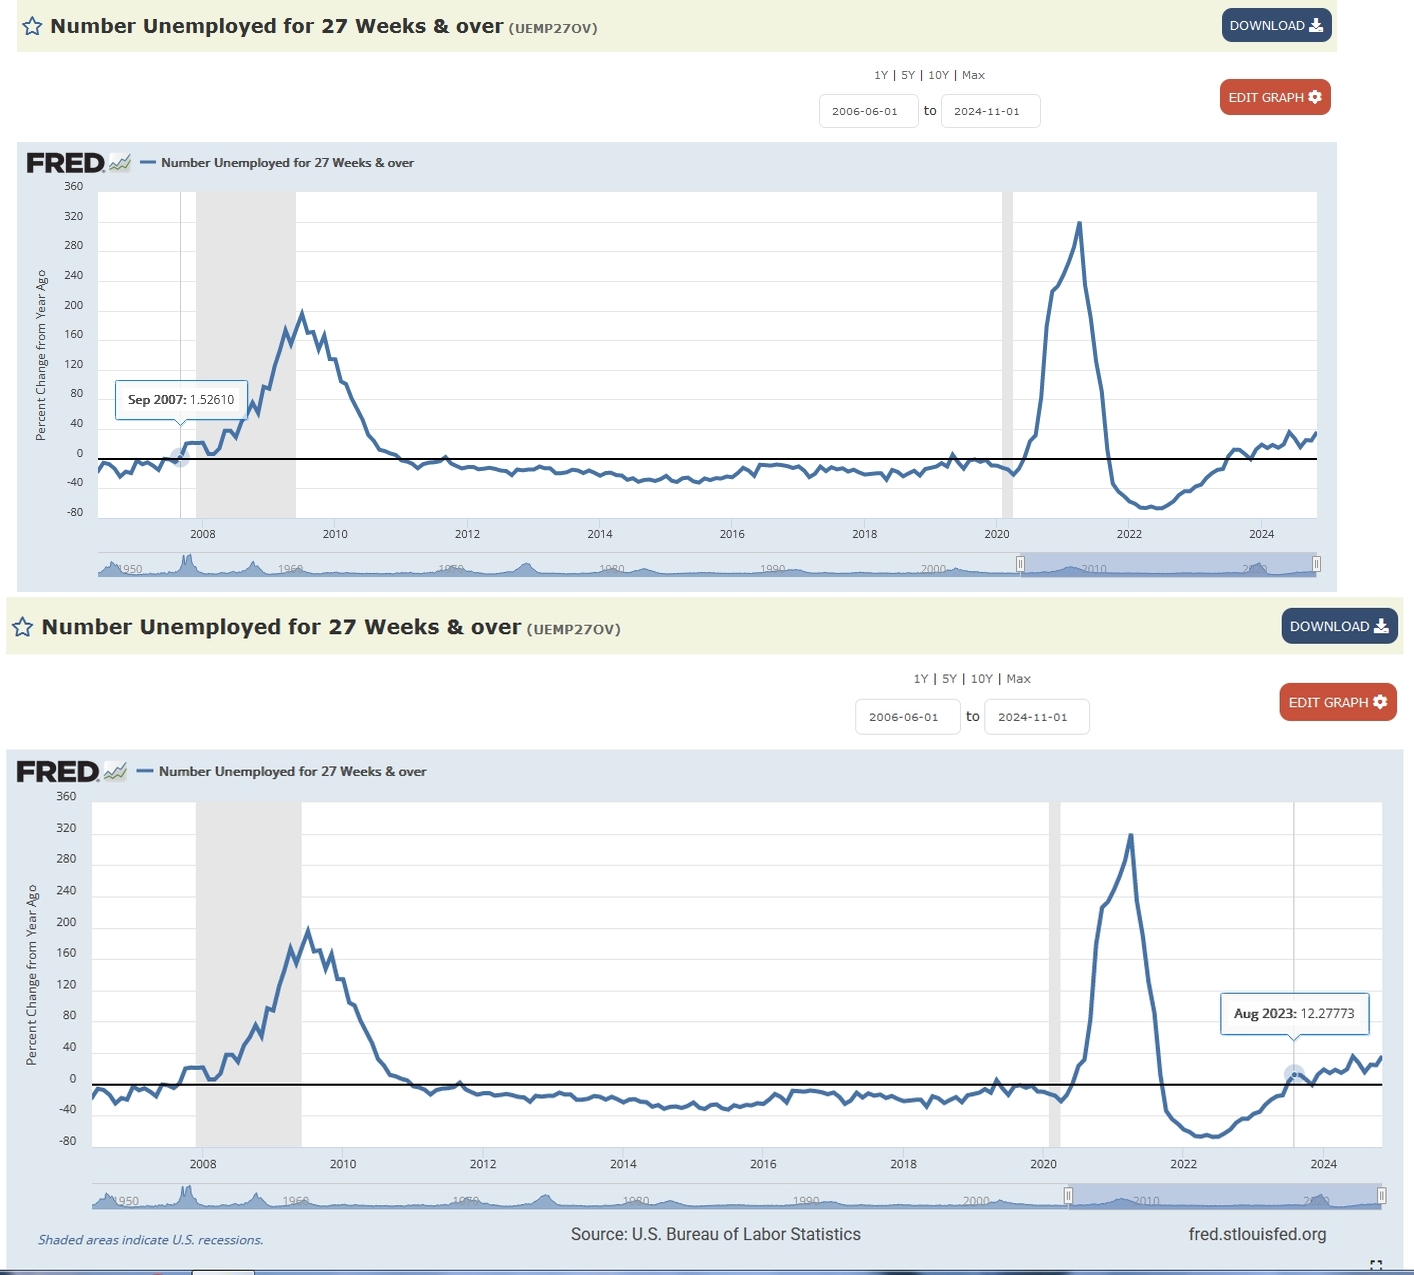
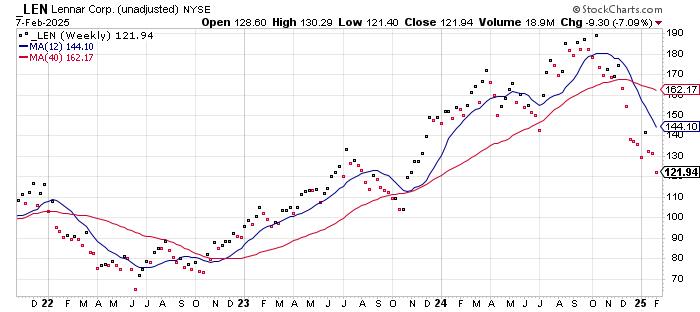
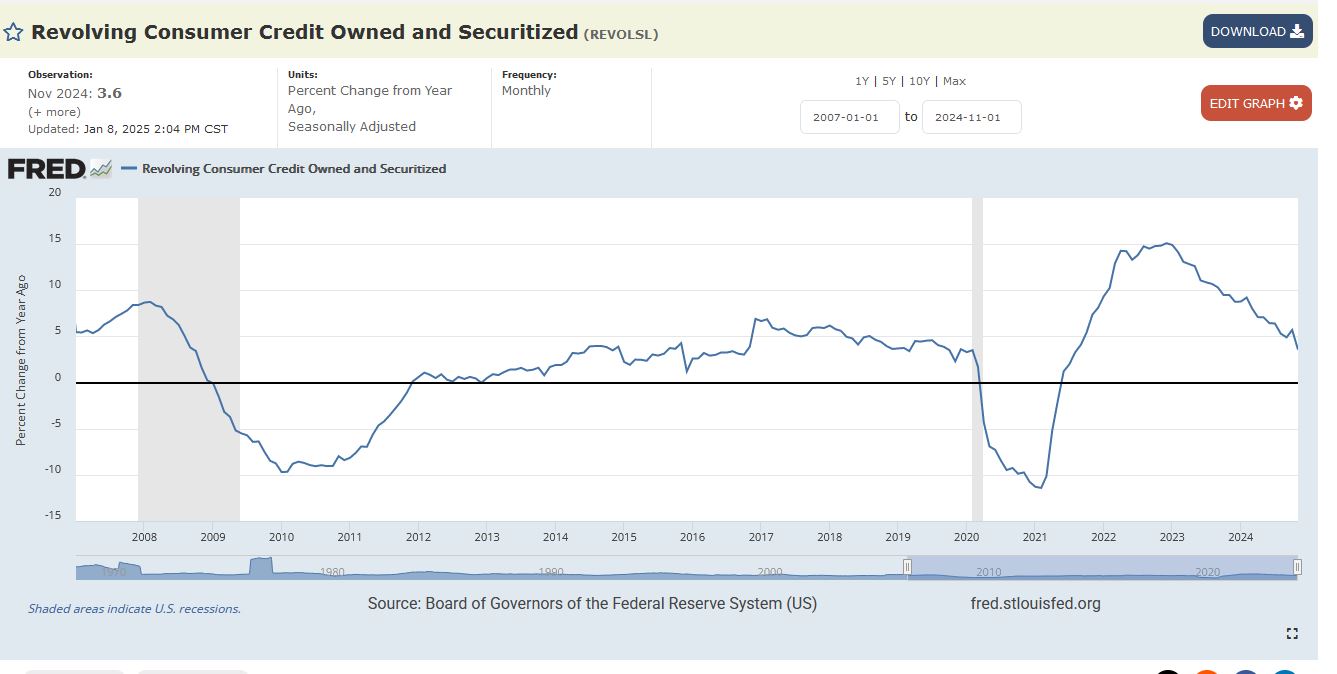
This is key to delinquency rates rising…
When this number rises recession is around the corner…