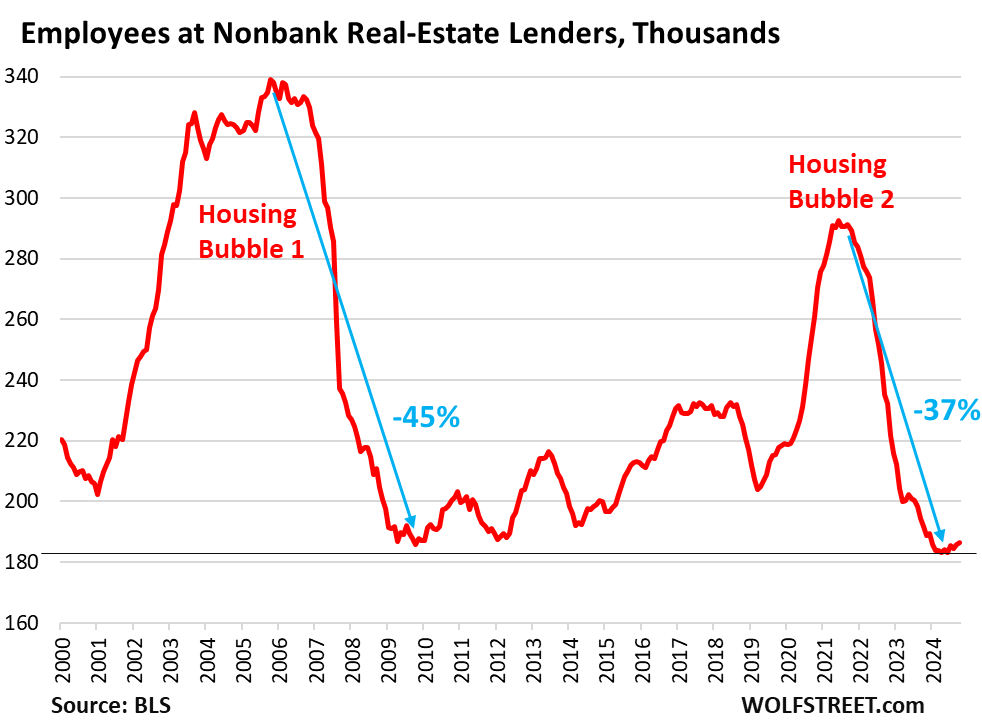
Unemployment starts up the year after construction peak (2006 and 2024).
See spike in construction unemployment in Feb 2007.

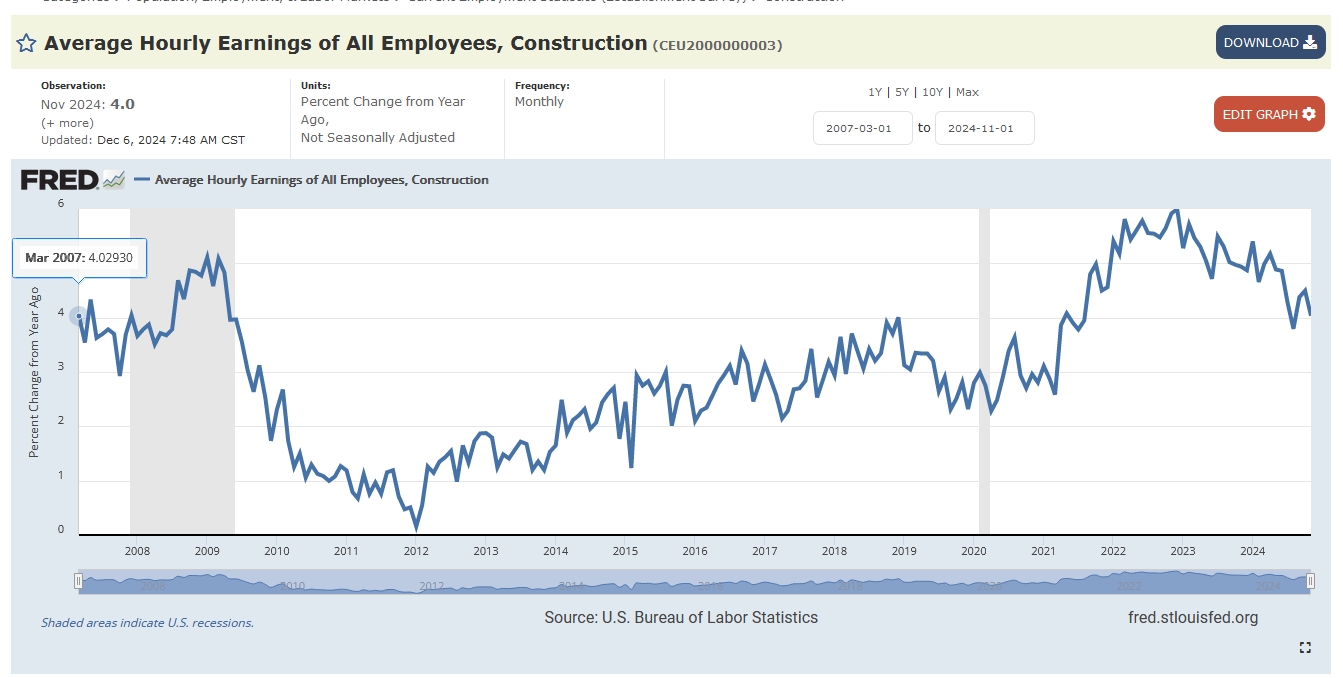
Construction wages are very high and each unemployed is equivalent to 3 additional jobs.

Wage growth is slowing now to 4%…

Unemployment starts up the year after construction peak (2006 and 2024).
See spike in construction unemployment in Feb 2007.
Construction wages are very high and each unemployed is equivalent to 3 additional jobs.
Wage growth is slowing now to 4%…

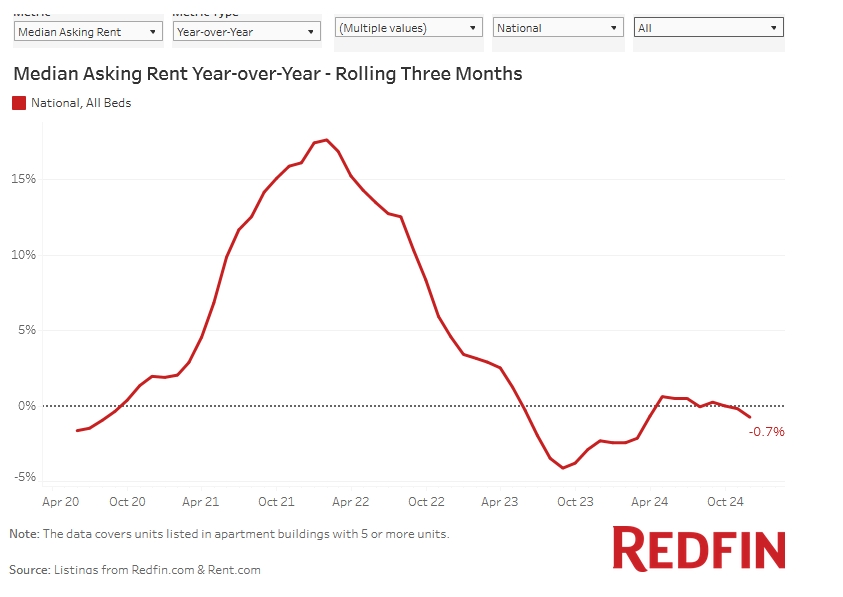
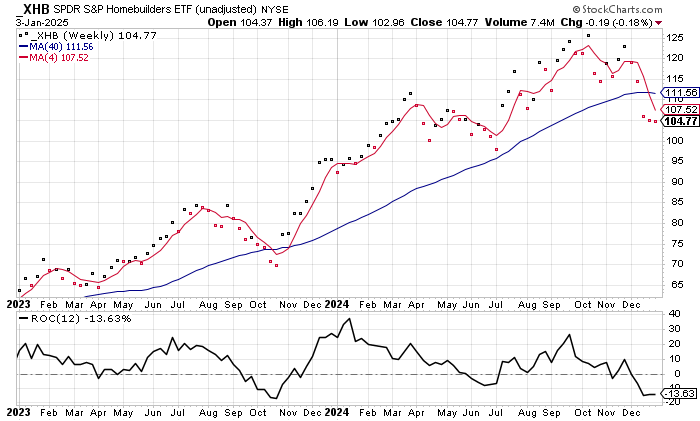
Home builders confirm bear market as of this week…

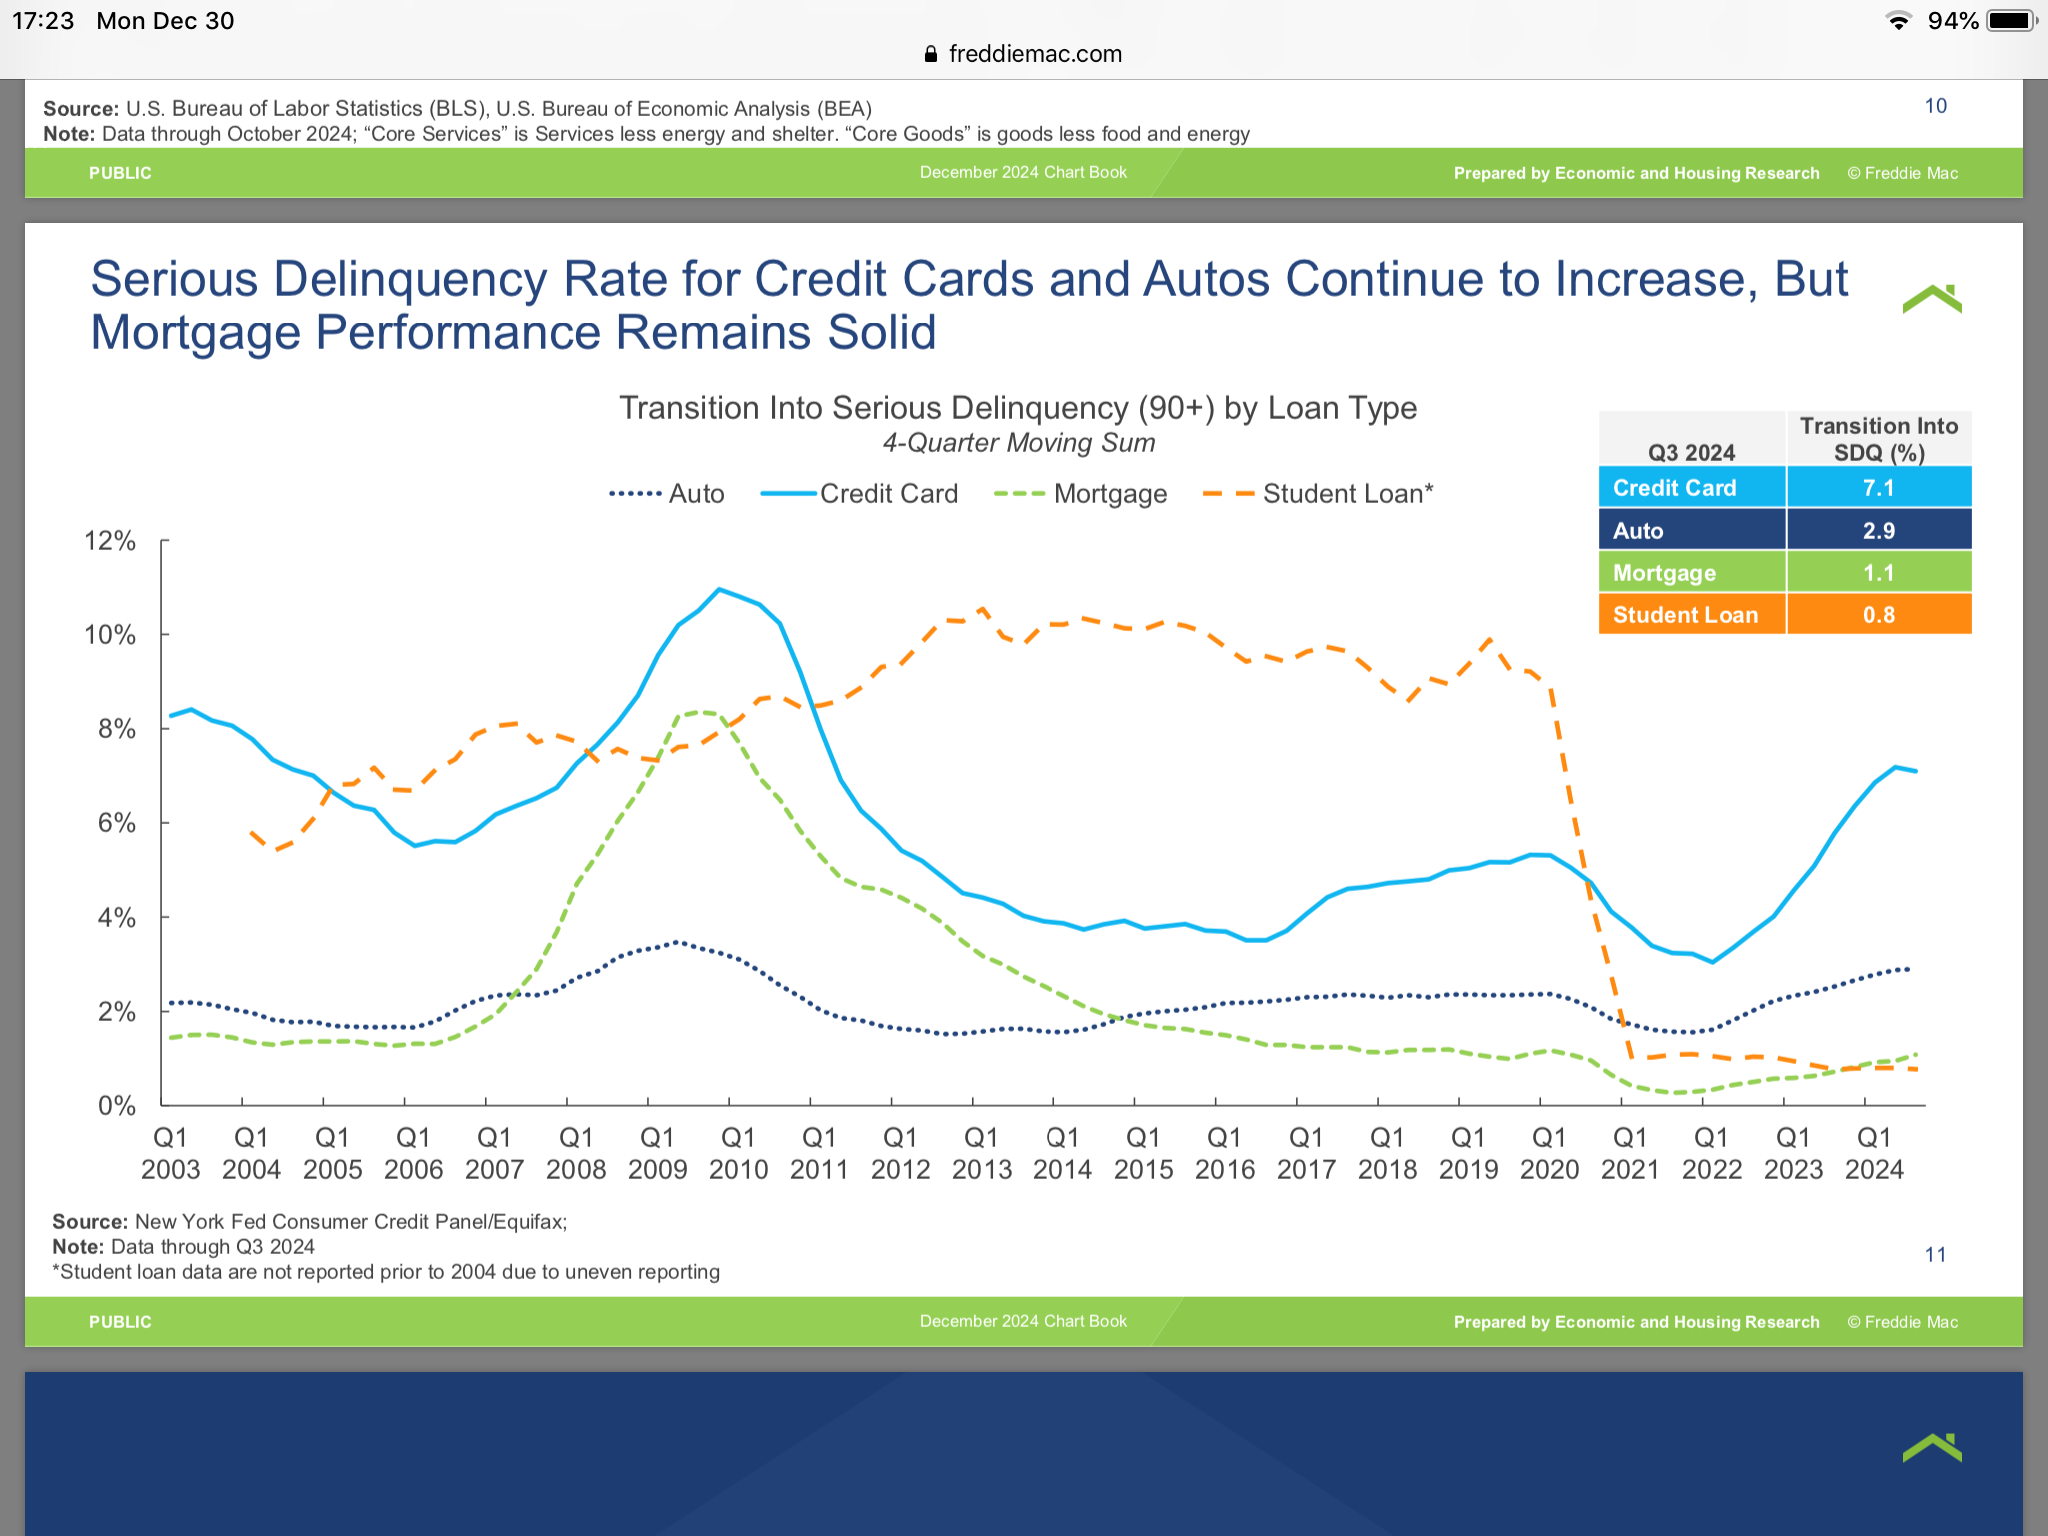
What coincides with construction downturns? Unemployment and mortgage delinquency..
MBA (Mortgage bankers association) even confirms that unemployment is key to mortgage delinquencies.

Market heavily overvalued….Shiller PE…

AND delinquencies are rising. Mortgages rise with unemployment the next 2 years.
AND historically delinquencies fall every year YoY.

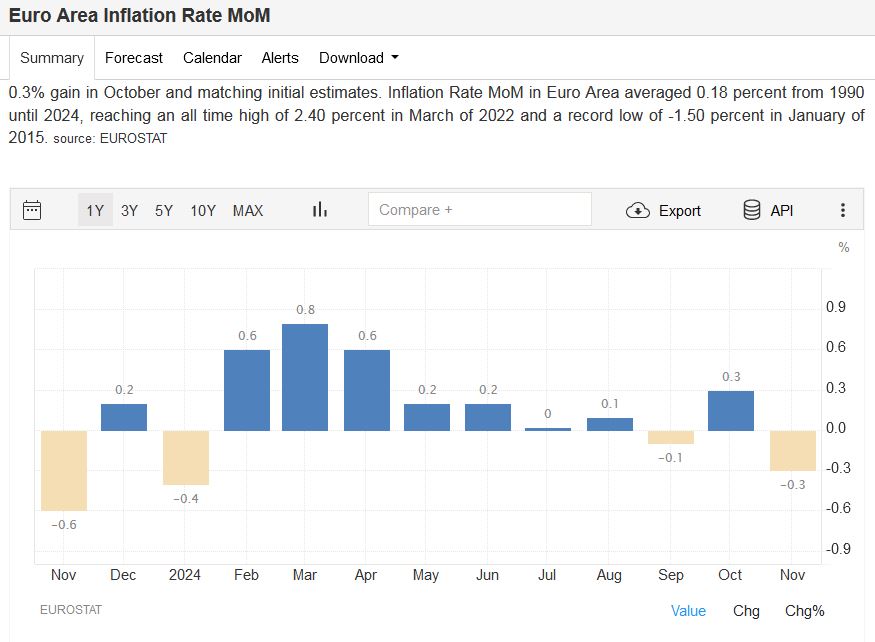
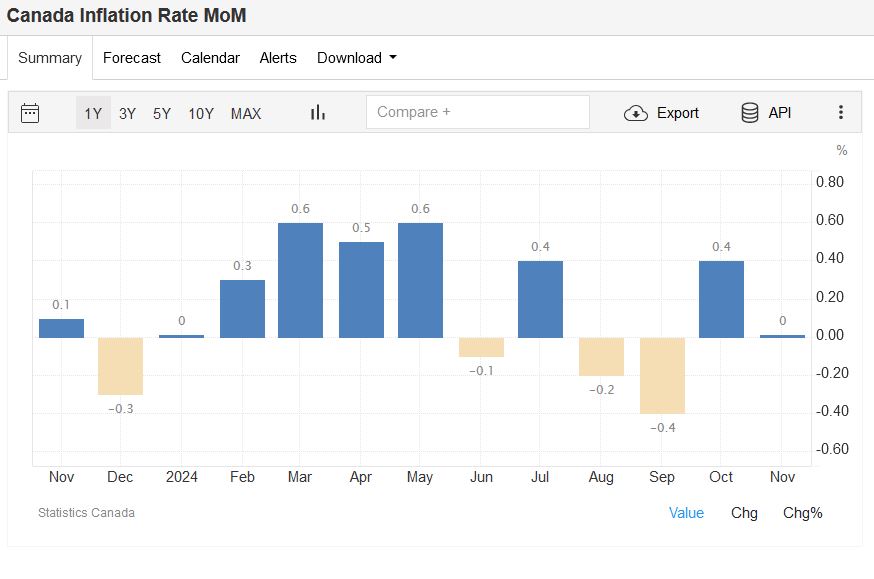
This explains the drop in rates Canada and Europe,,,,50 bps each meeting.
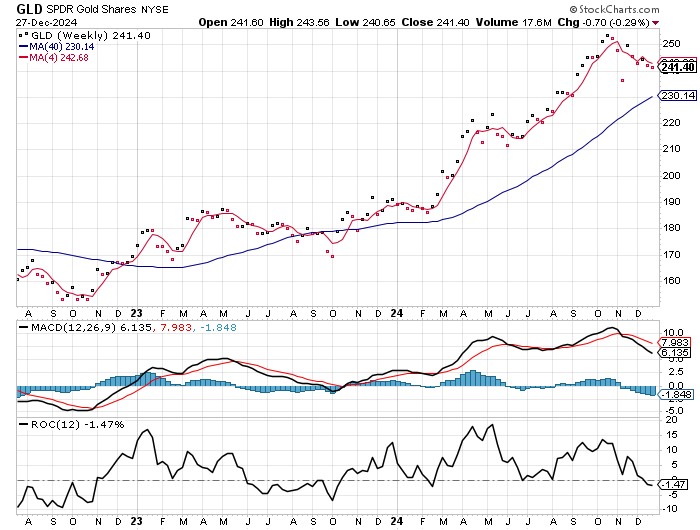
Gold now trades with the euro and inverse USD as it should…
Last Dec trending up…this year DOWN.
AND downtrend gold means downtrend inflation !

Rising 33.5% next year means next year at 30,000 plus then massive acceleration in 2026!
In 2008, it peaked at 60,000 in Q4…
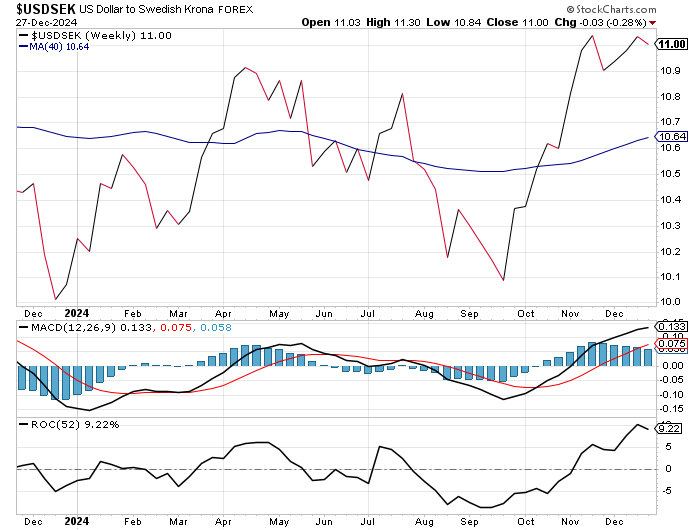
Swedish Krone falls 9.2% this year..

XLE bear signal has arrived now ….4 weeks down and -10% (-13.5%)…