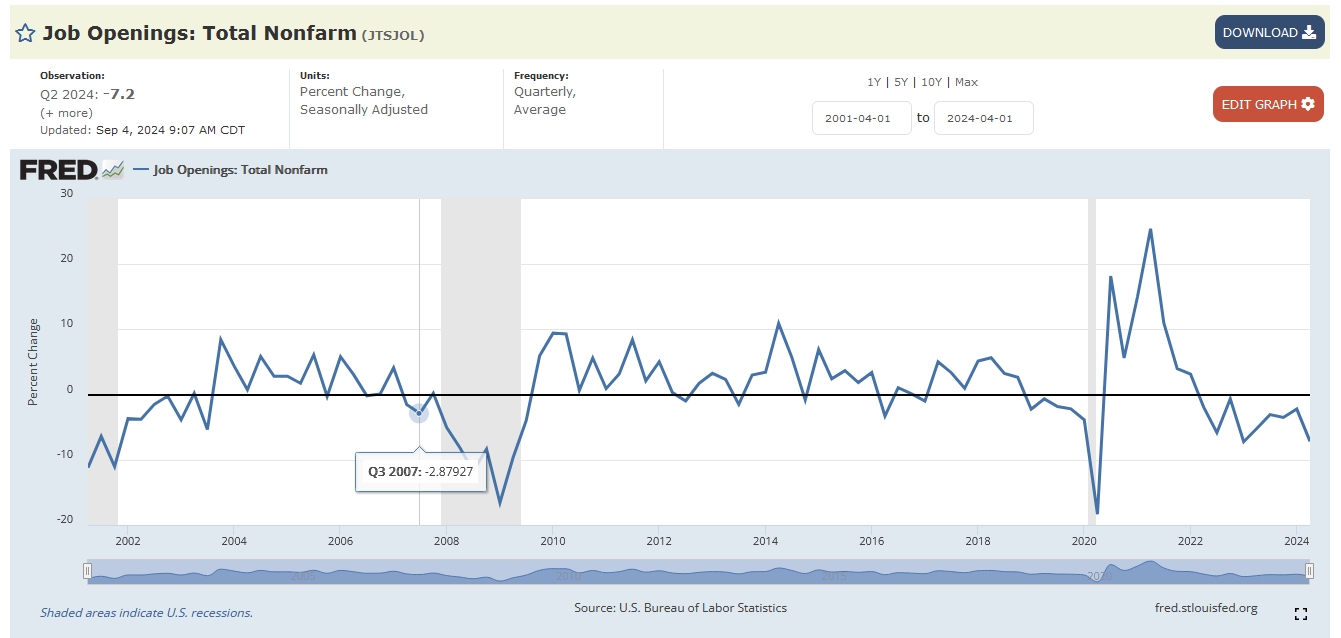
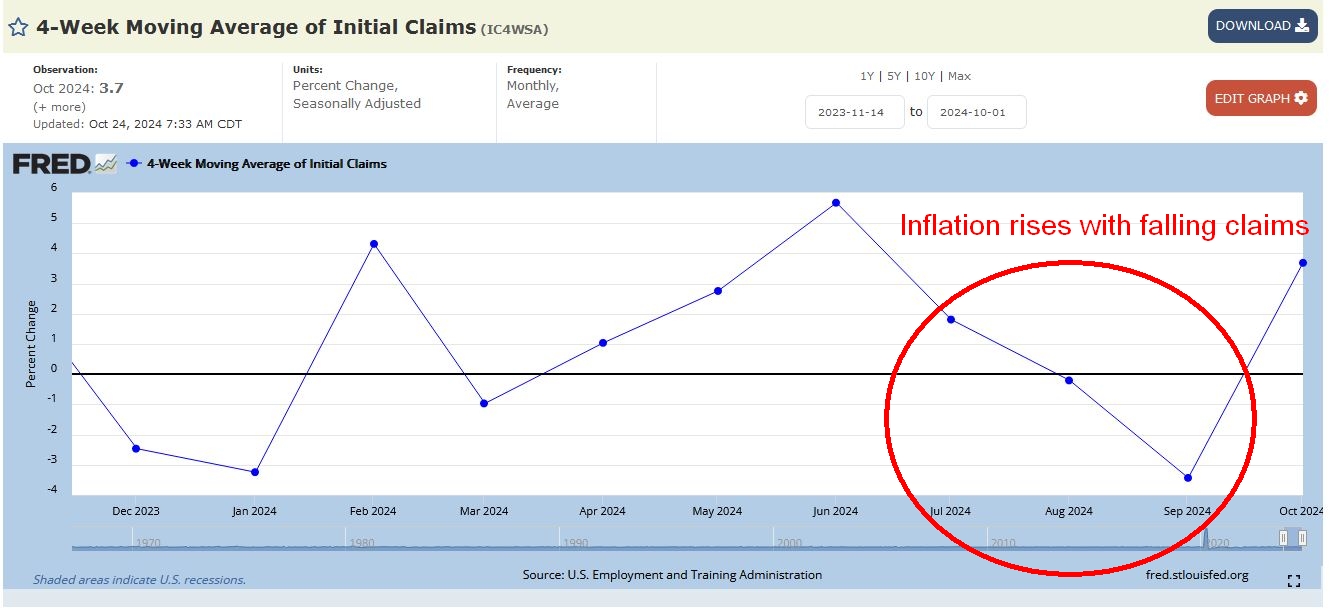
Notice that UC fell for 3 months and inflation reported higher at 0.2 .
BUT NOW Oct is rising rapidly again like May and June.

Notice that UC fell for 3 months and inflation reported higher at 0.2 .
BUT NOW Oct is rising rapidly again like May and June.
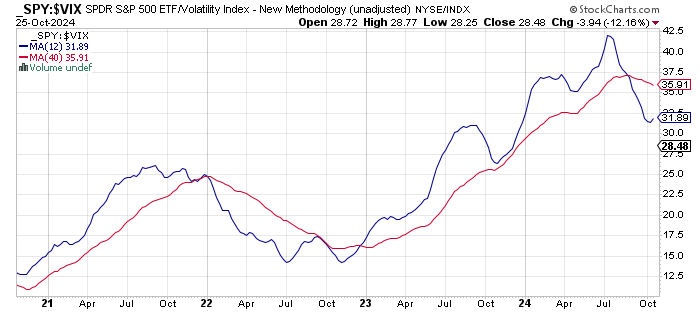
Can see clearly bull-bear transitions…bear started end of Aug…

The Fed wont be able to stop it. Eventually, gas-oil prices will be quite cheap by 1st week of March sparking a rally. But only over the spring then fall again from summer- fall.
Meanwhile, delinquencies on all loans keeps rising…the hidden monster.
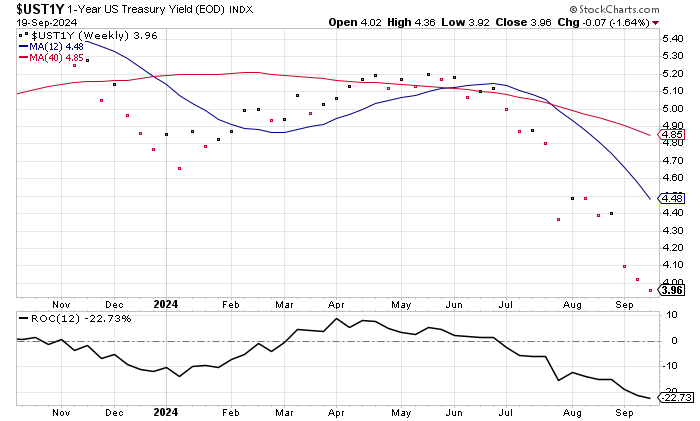
See below the 1 year Treasury confirming the deflation in July.
Fed has to catch up big time!
1.482 T or -10% of all mortgage debt was written down..
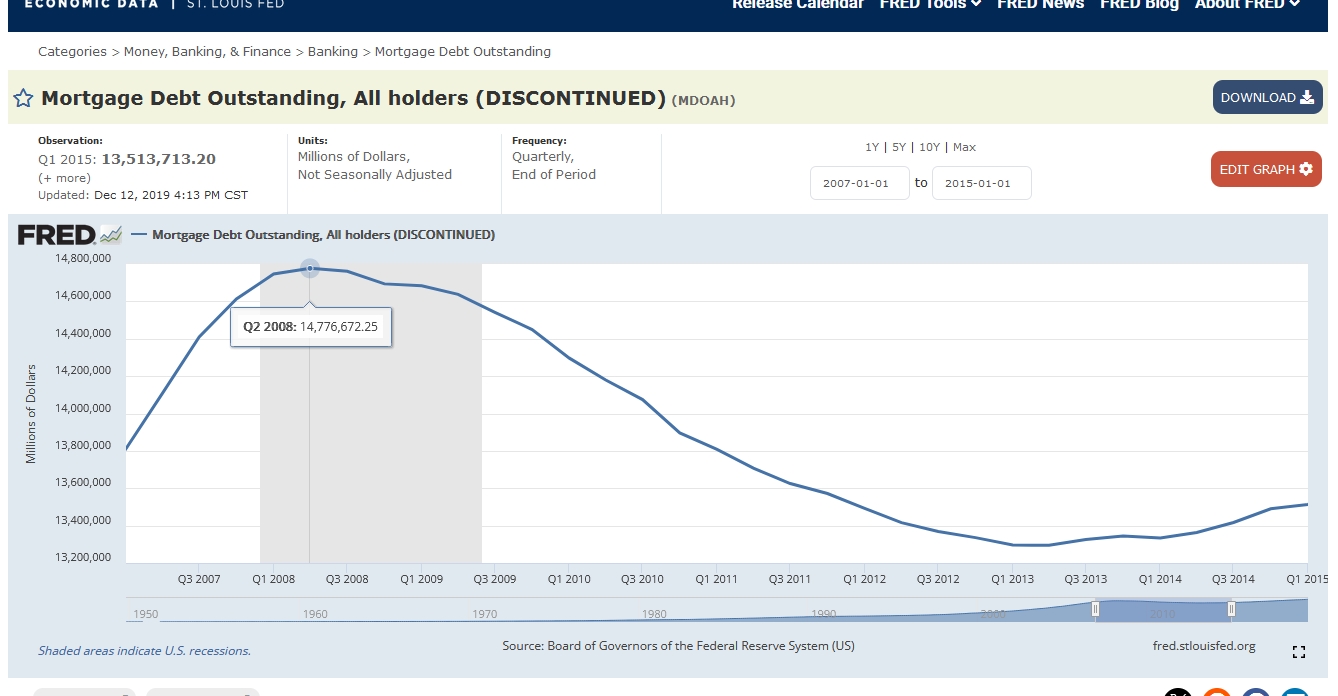

Now outstanding mortgage debt
Q2 2024 20348B or 20.348T
-10% would be 2.035 T OR 37% more than last time.
Wealth lost is about 16X or 32T…
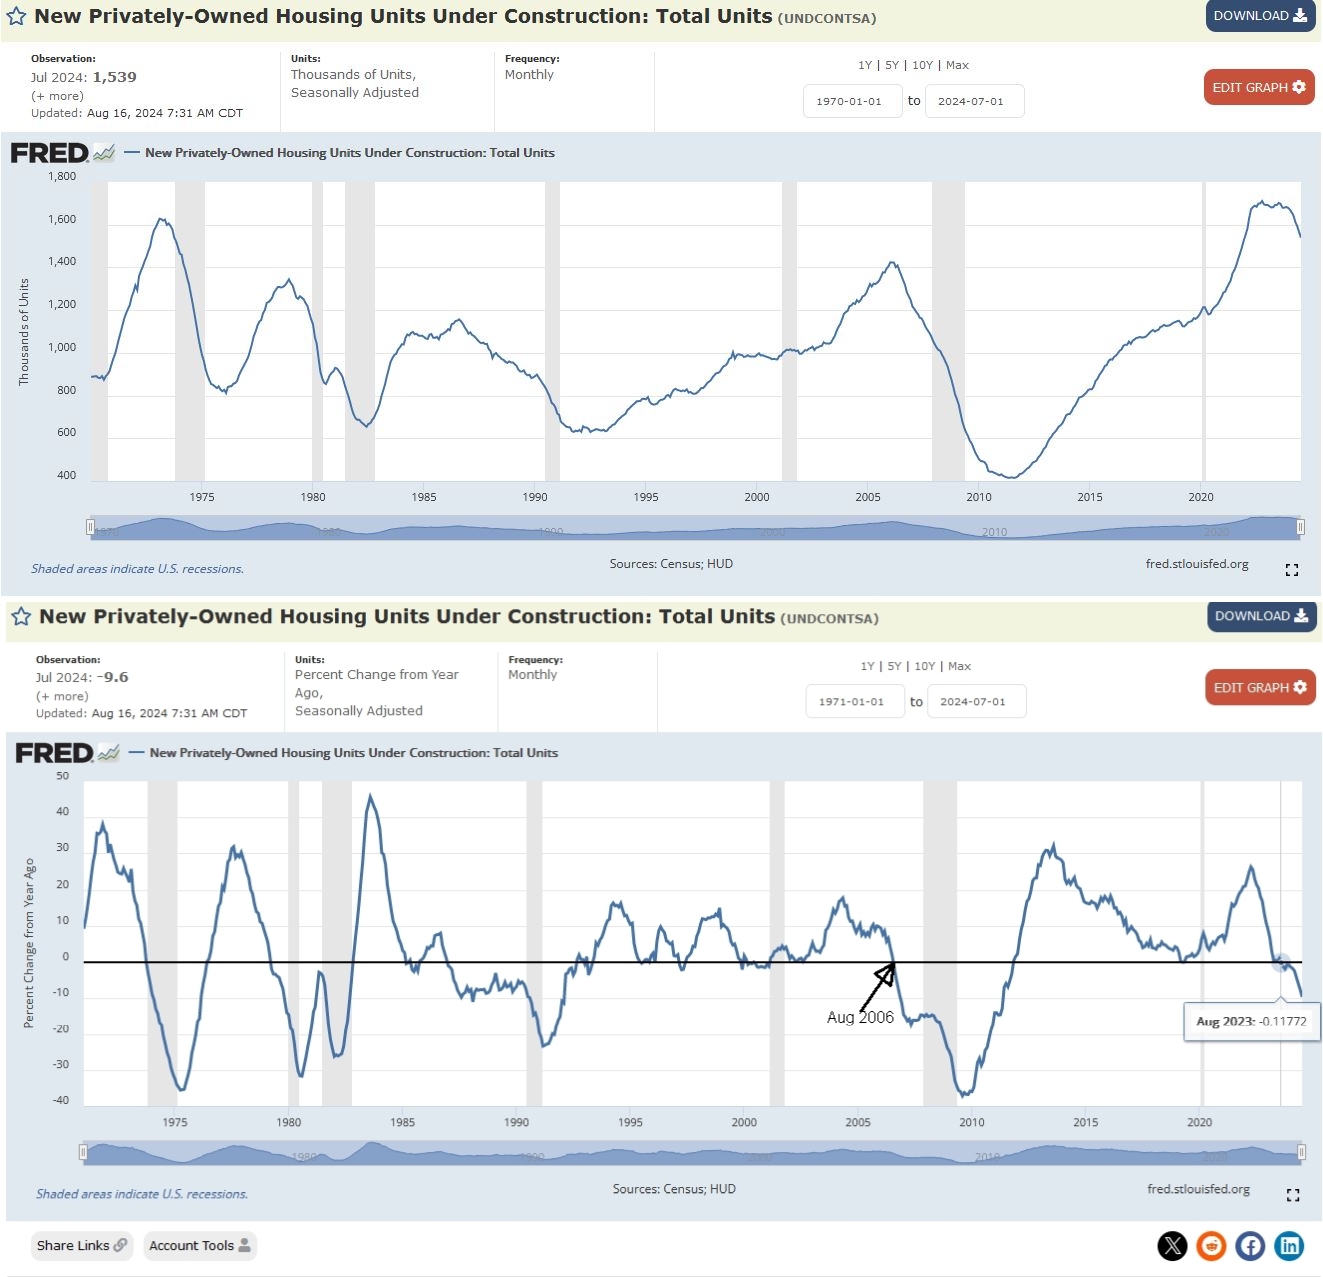
Clearly the biggest housing boom has occurred. Peaks were August 2023 and August 2006.
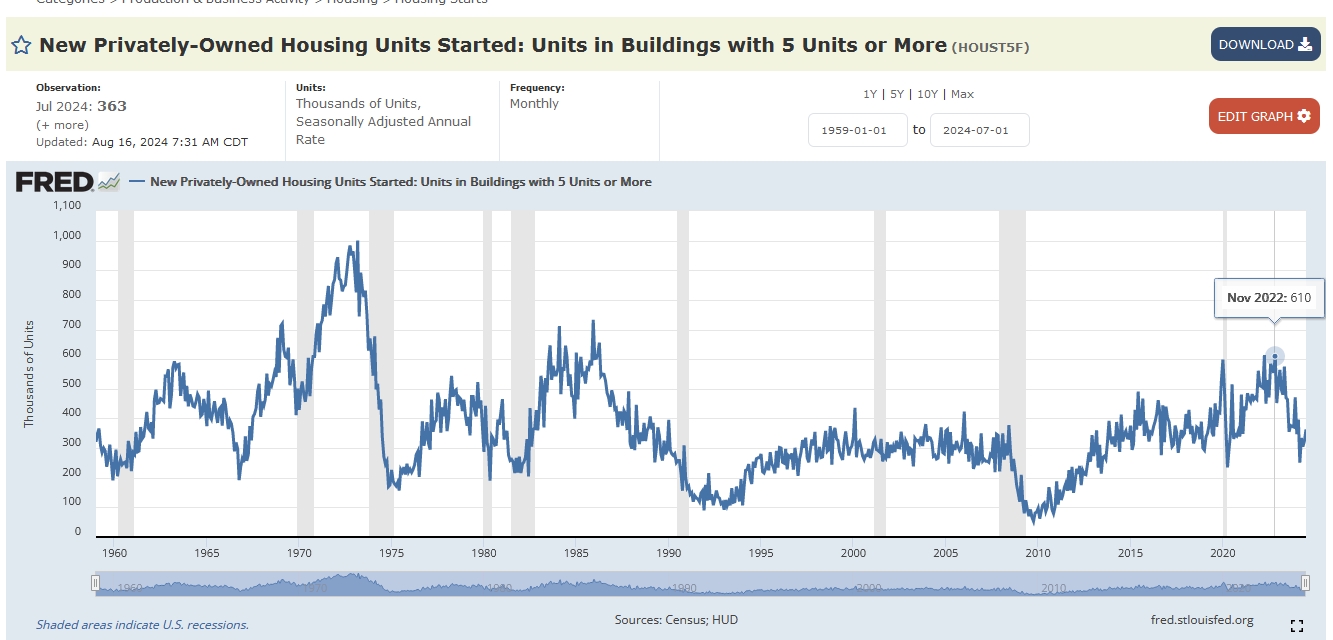
More new apartments and condos…peak was Nov 2022.
Construction is 1 year ahead of price….both for downturn and upturn.
Downturn was Aug 2006…price peaked 2007. Upturn was Nov 2011 and price bottom was Feb 2012 but end of 2012 was also good.


Resolutions don’t happen in this phase as bread and circus are too strong!
Clearly the decline period is managed in a relatively straight line downwards.

So expect a 36% drop in RE prices (inflation adjusted).
Current Price 325.4…about 228 in 5 years.
Approx 30% (for low inflation 1% the next 5 years…)
Some say 40% (nominal) and 7 years…7 year cycle more traditional.
Inflation adjusted rates of return (from bottom)
1999-2007 8.4%
2012-2024 6.2%
2030-2040 4%?
If you buy near a top, rate of return is just 1% not accounting for depreciation-houses get old- which would make it negative. (13% since 2007 top or 0.8% per year).
Clearly growth is slowly dying…