-
Recent Posts
Archives
-
Other Indicators
-
Longer Term

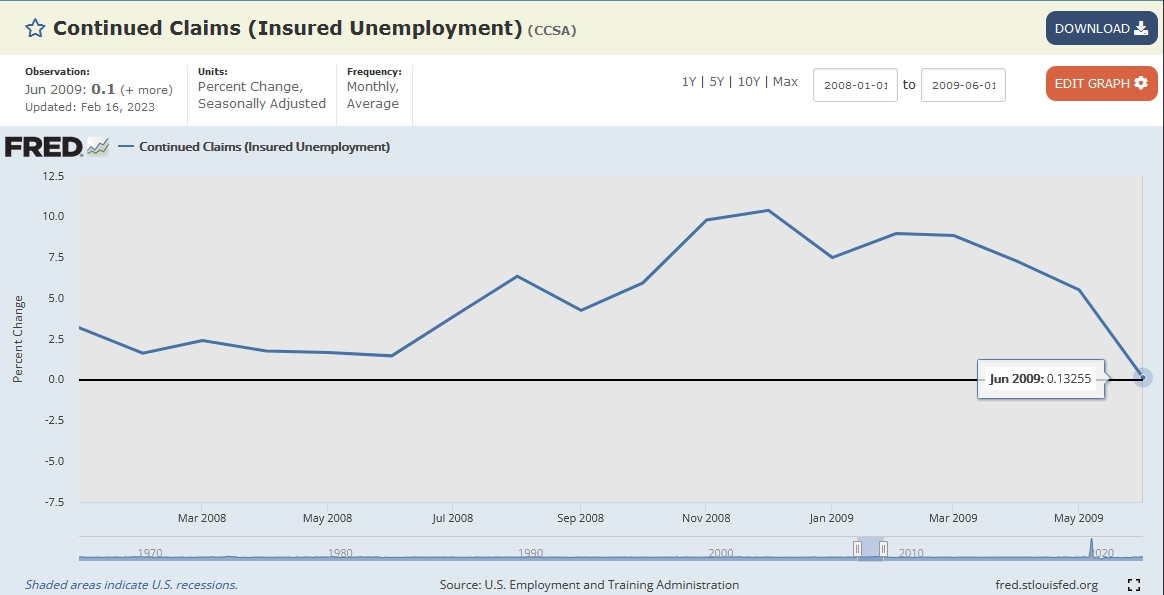
The continuing claims monthly change has the same trend as unemployment rate…
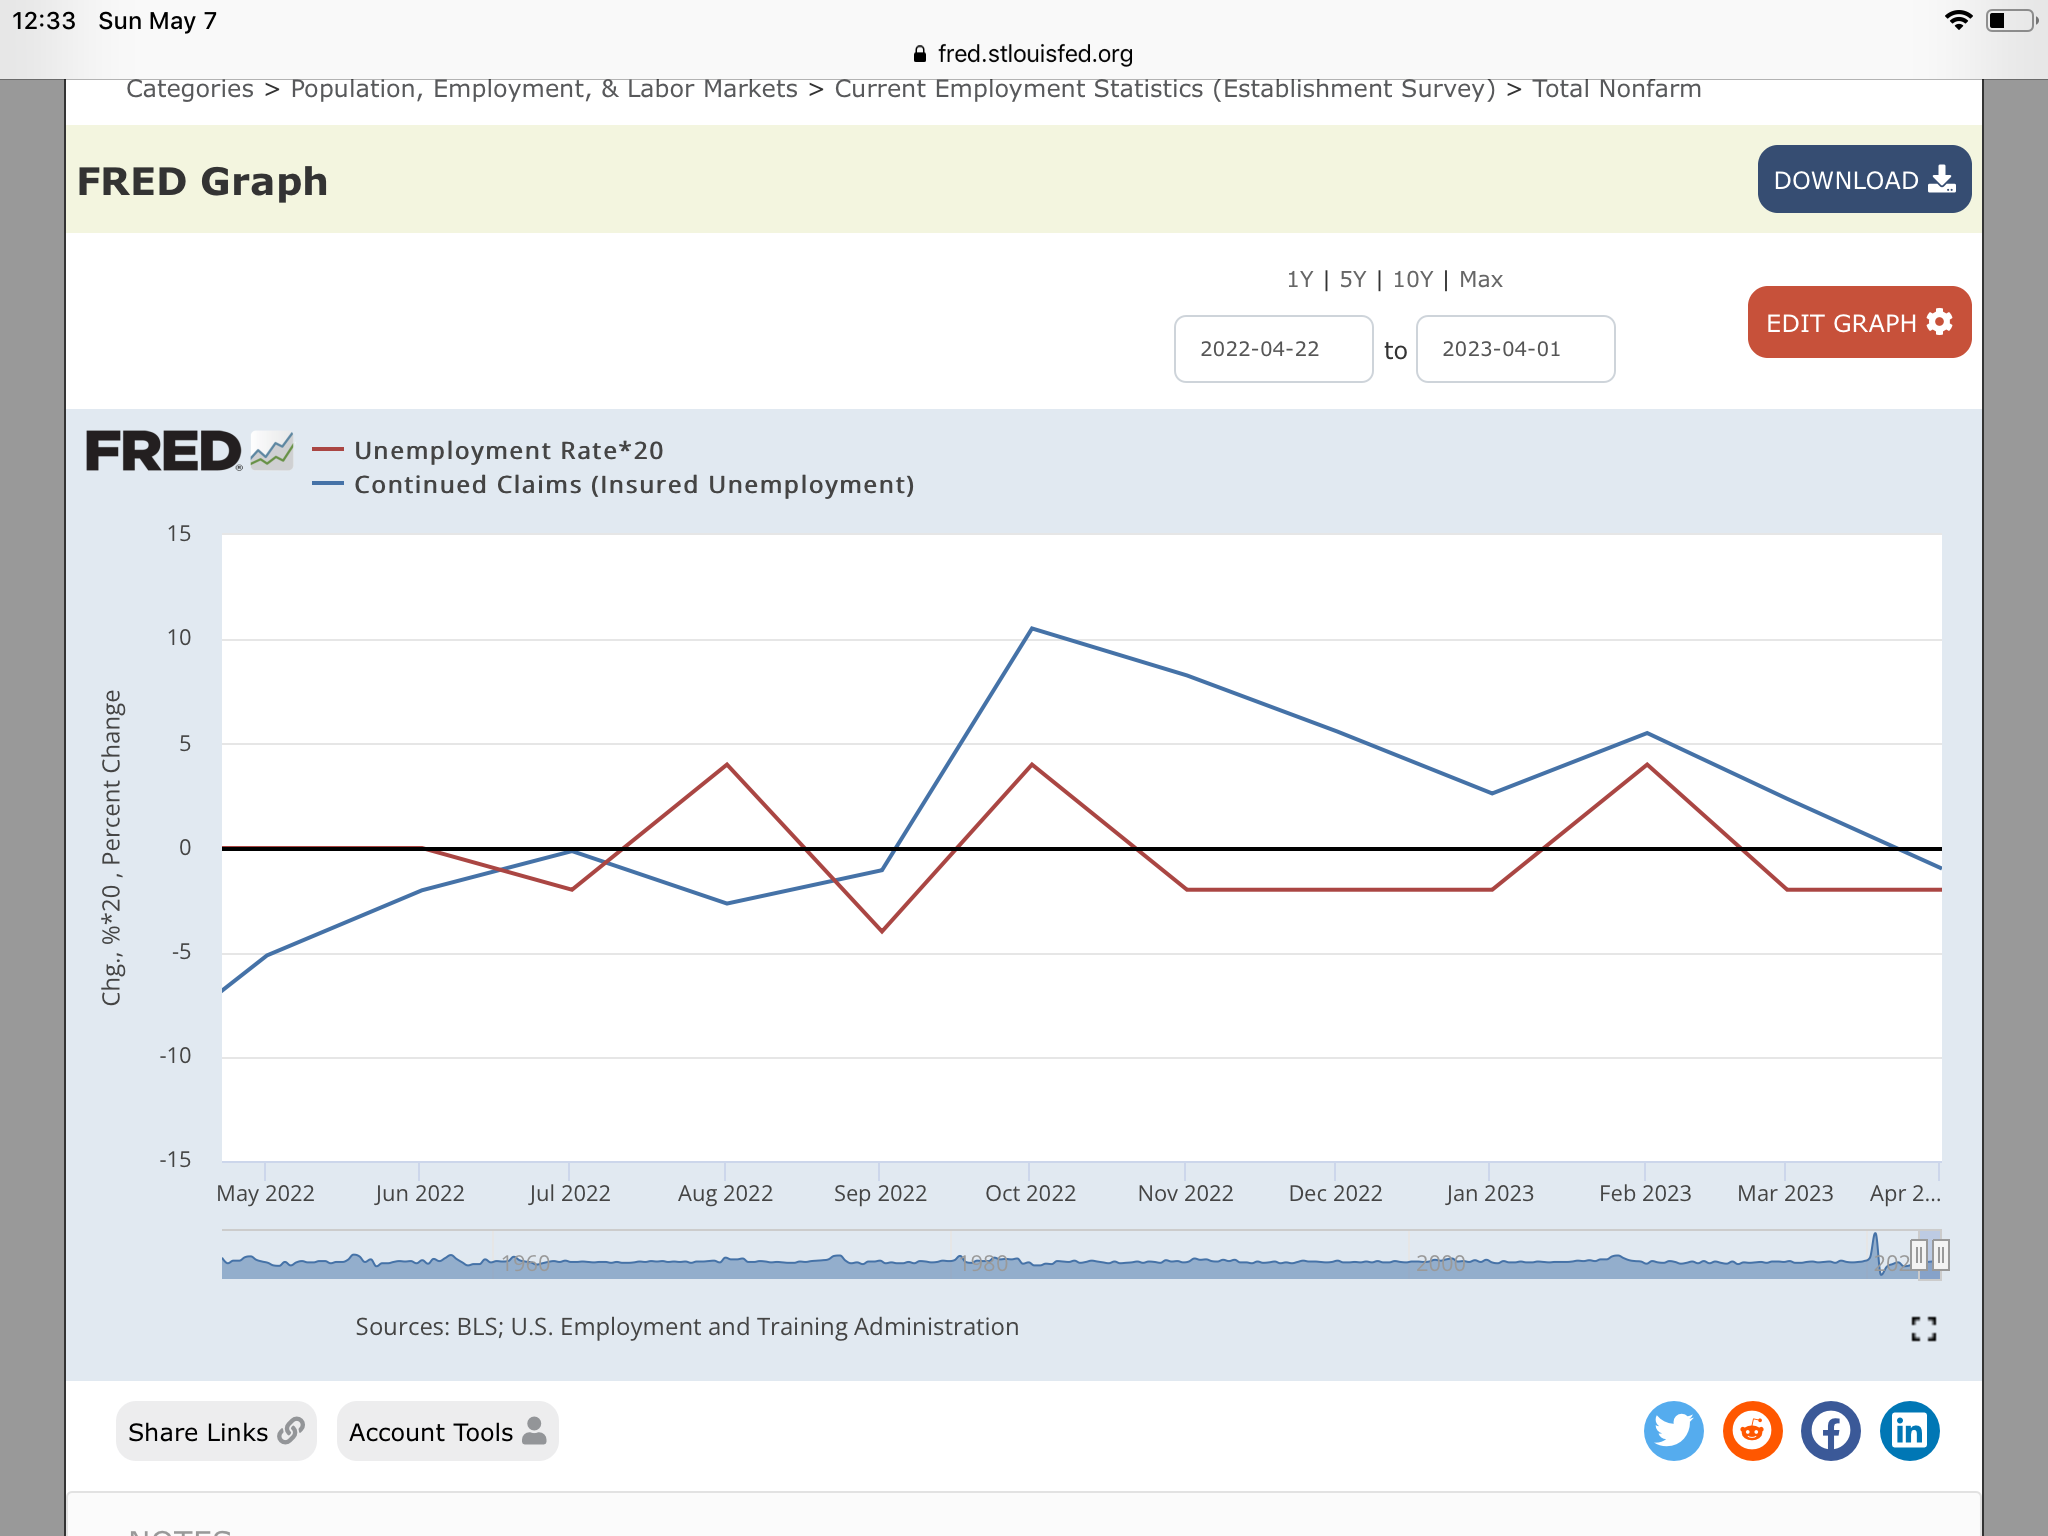
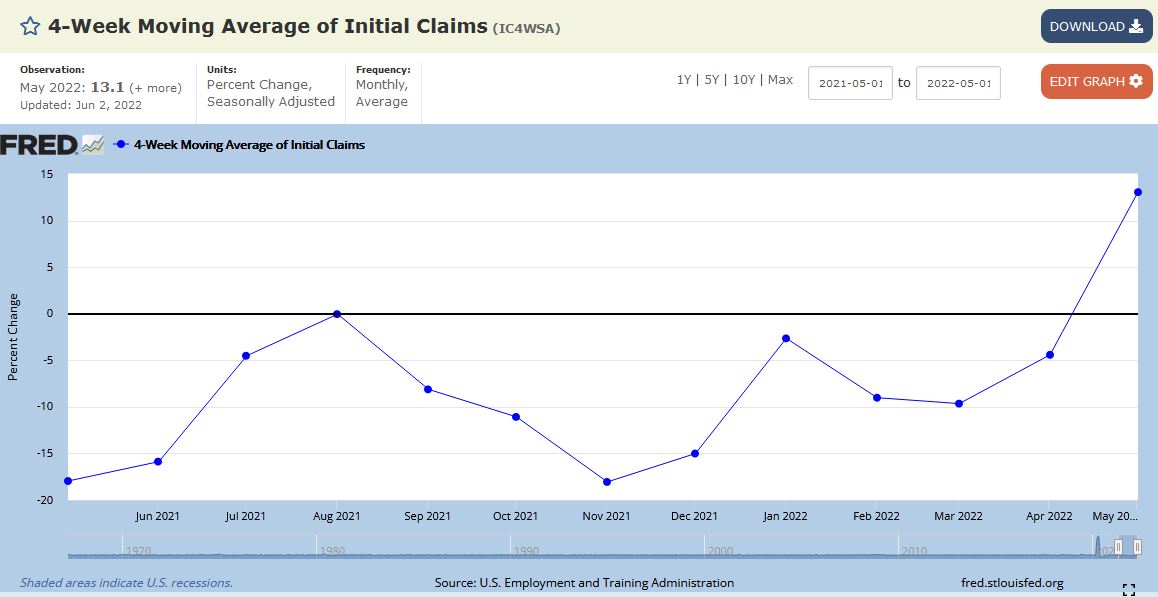
Payrolls vary too much to predict and aren’t as stable as the unemployment rate. Study was done on unemployment claims 4wkma and found it lacking as well as SPY monthly change.
Good news as the hysteria of the last 3 years has ended with declaration of pandemic over on May 11 and last Friday. It’ll be another 20 years before the next hysteria.
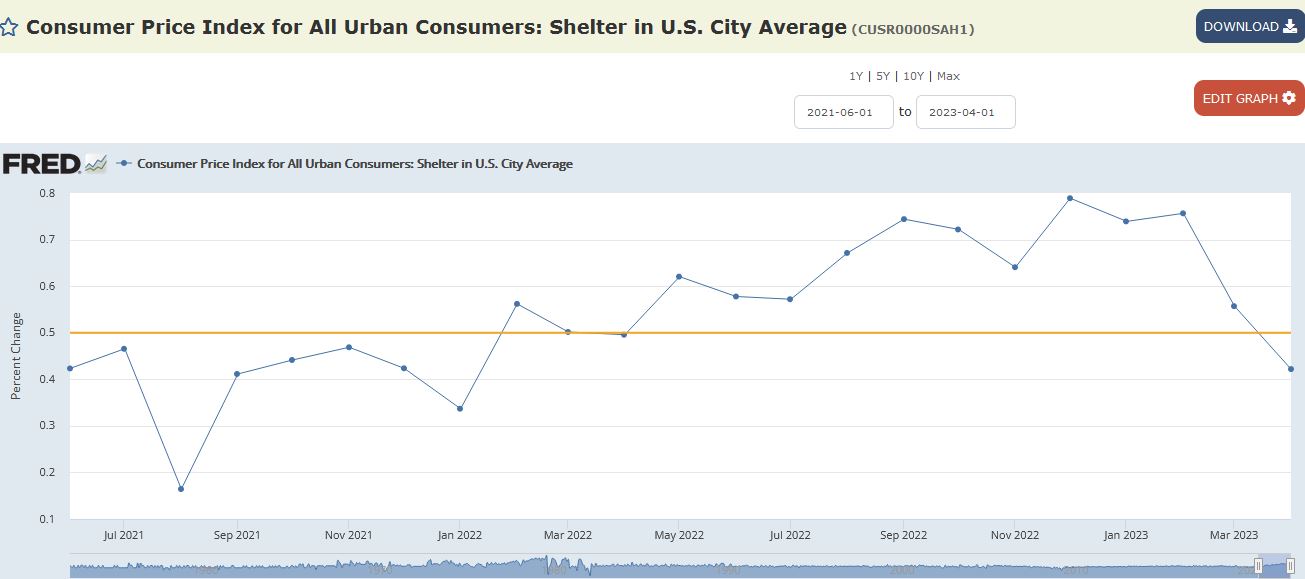
Link changed to end of month gasoline change. This predicted the Jan rise in inflation much better than the average.

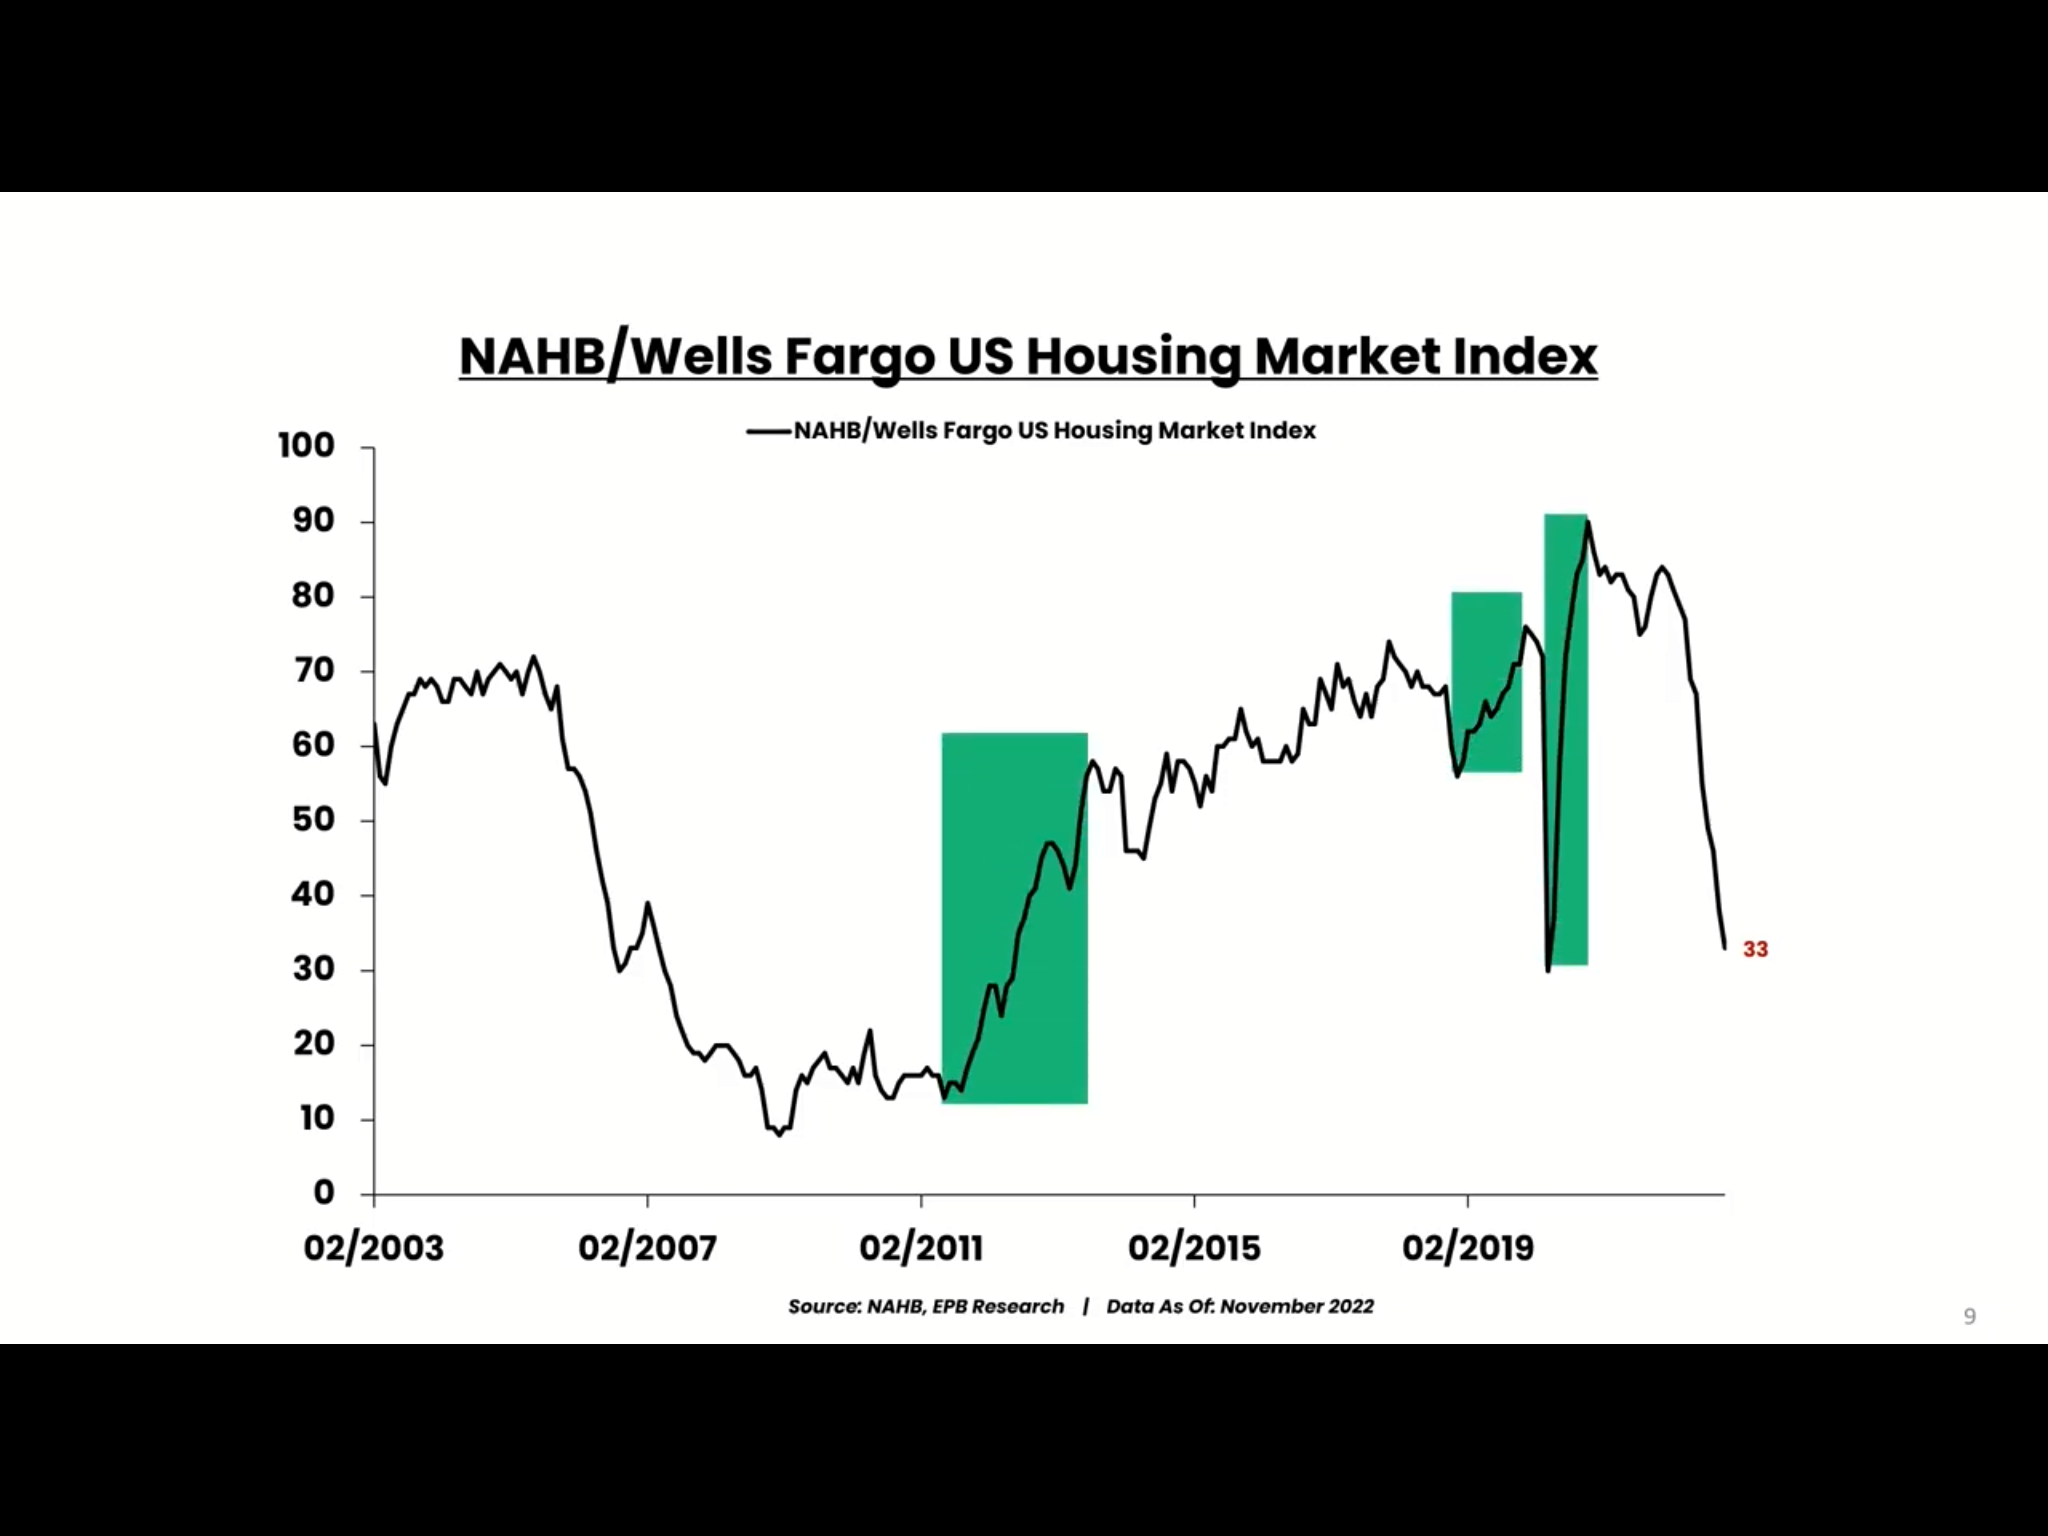
https://www.nahb.org/news-and-economics/housing-economics/indices/housing-market-index
This is single family only I believe…so may have to check multi-family. Case-shiller YoY price movement gives same results.
Peak was Apr 2006 and bottom was May 2013 or 7.2 years (the often quoted real estate cycle). Current peak was Jul 2022 so bottom will be Jun 2029?
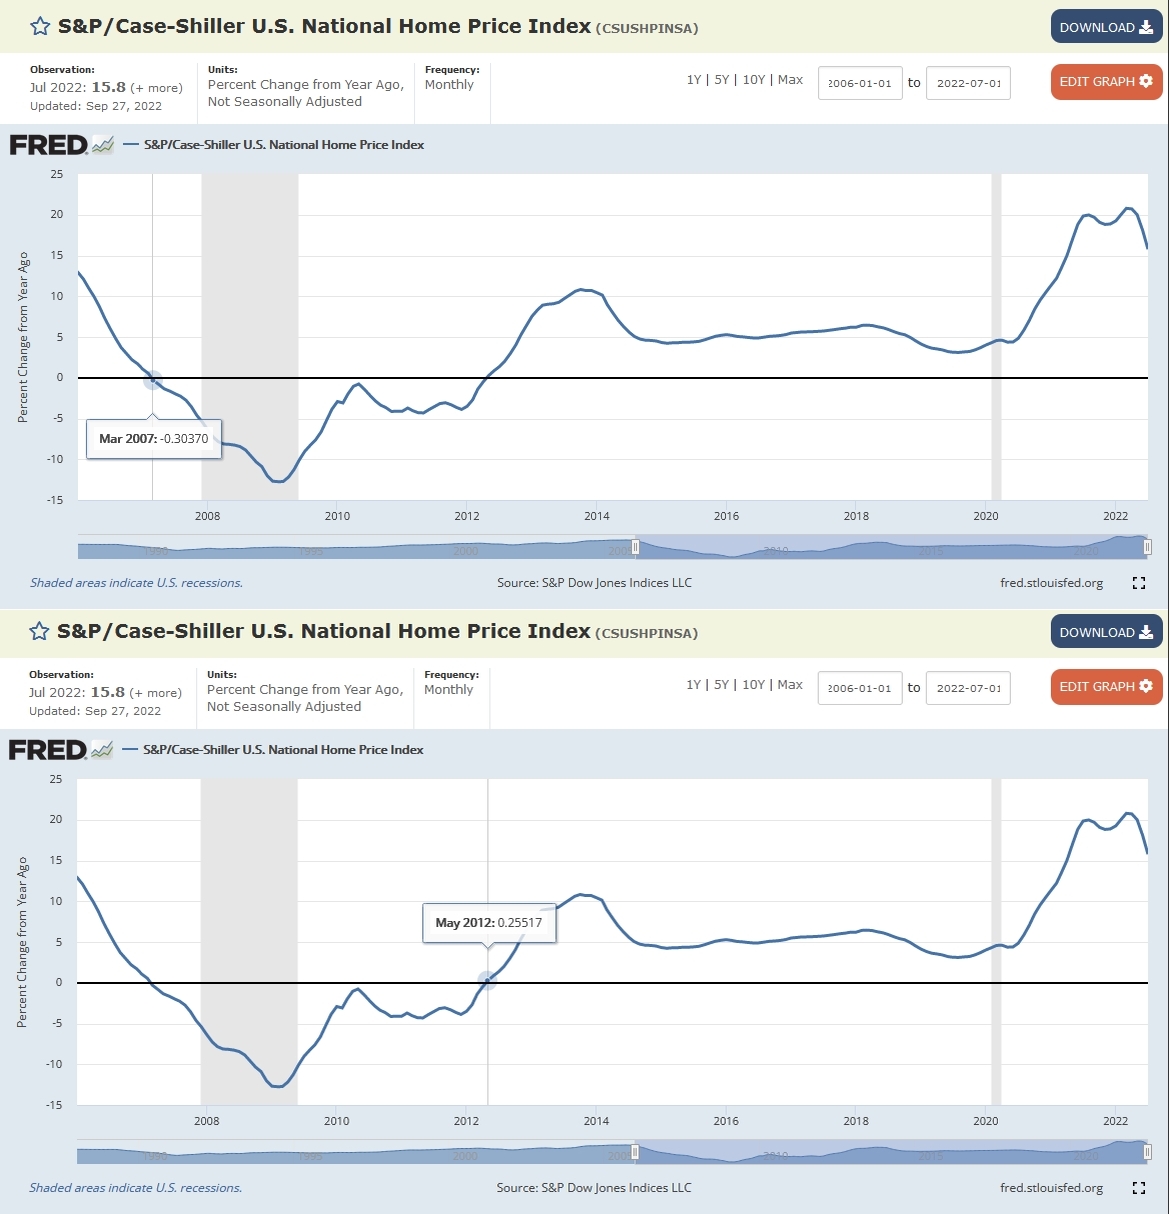
Case-shiller was delayed 1 year (2007) but was early on the buy side (2012). So Case-shiller may indicate to buy in Jun 2028.

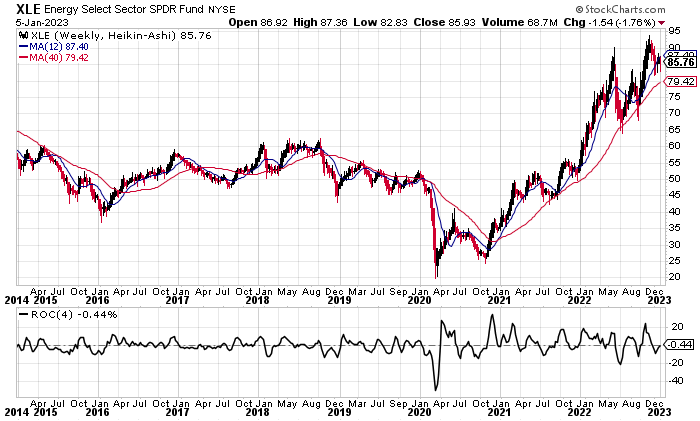
Despite QE and stimulus …all reflected in XLE !
For TLT, two considerations-
When year over year case shiller turns negative…bear market real estate. When it crosses to positive…back to bull.
Real estate is the primary asset of middle class and reflects true state of consumer confidence and economy.
After credit cards started growing again in Jan 2012, real estate picked up 1 year later. And stocks picked up Jan 2013.
Bear market begun in Jan and now jobs start to go…