
The change in claims is the least in 10 years showing a rapid slowing now.

The change in claims is the least in 10 years showing a rapid slowing now.
TLT:SPY ratio turns on Friday……last xover was 1st week October…

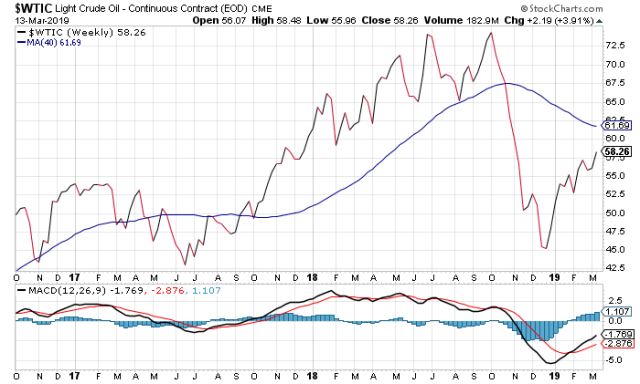
Oil will steal all the growth as it did in Sep/Oct before the last bear phase. Now SPY back to BULL until July when growth stalls again.

Long term VIX lines confirm a new bull phase..

And 3 mo:

Mid-june brings the blue line to 14 and end of June 13.5.


Forecast


And Job Cuts Rising:

ISM Forecast to cross 50 by Apr-May:


ROC5 now 0.28
and ROC14 is 2.5
OEX has topped also….puts and calls being closed for Mar 15…


late 2008 and 2009 were +ve only due to deflation!
And UC X the zero line…will check quarterly in 3 weeks…


Low gas prices feeding into rising core inflation…..
YoY inflation strong at 2.1 and will surge next month….as Feb 2018 (0.17) was quite weak.
Unemployment claims to cross 0 soon:

USD returns to uptrend and continues to indicate an overall bear market this year.

Q4 GDP will be announced Feb 28.
Conclusion:
SPY and Oil have risen slowly during Feb. Most likely to go flat weeks 3 and 4. Inflation becomes a problem again for Mar 20.

Falling inflation like late 2014 and 2015 indicates weakening growth. Dec 2016 until Nov 2018 were positive showing strengthening economy and rising markets. And now Dec 2018 / Jan 2019 show a weakening growth despite increasing wage growth.
REAL POSITIVE RATES NOW (xover was 1-2 months ago!):

Asset prices fall with positive real rates! Soon 2.6 by March for Fed rate and inflation maximum 2.2 and predicted to fall by the Fed!
WITH POSITIVE REAL RATES CASH BECOMES PREFERRED OVER ALL OTHER INVESTMENTS.


