
The world has progressed relative to the US.
And the job creation problems of the future from:


The world has progressed relative to the US.
And the job creation problems of the future from:

Core inflation as predicted 2.0+ ! Monthly inflation 0.1755.
Table below-

In order to have a bear market, unemployment claims must be rising and delinquencies. Both are still falling…UC quarterly below…

The last bear market began beginning Q2 2007:

The Fed lowered rates for the first time on Aug 1 2007 or 4 months after.
The MOST DEFINITE SIGN of a bear market is when the Fed lowers rates for the first time. Usually the market falls just before and after this event.


From biohistory part 3. Shipwrecks declined 98%!
Wages are rising as fast as early 2006 upside and 2009 on the downside SO inflation should be sustainable through 2020. Since 2016, it has been above 0.5% most of the time.
The dip in late 2014 and 2015 is due to QE by ECB and the crash in oil prices which has reversed. ECB will start to raise rates in Sep. ECB QE will end by the end of April.
Unemployment claims are very low as well so wage inflation has some stickiness until just after recession 2020.


Next month ccpi will rise by 0.12 (average for mar)–0.073 (last mar) or 0.193 to give 2.05 ccpi.
We are above 6y trend inflation and over last year. See Mar, Apr and May last year when inflation was way below trend!
I assume average inflation+0.015 to estimate monthly inflation numbers. 0.015 is 45% of the Feb 2018 above 6y trend inflation number 0.033. So this is a conservative estimate…

Considering a market drop of 10% in February…inflation has held up pretty good. March is the first full month of tax cut money. March was very weak last year so that’s why the surge to 2.05-2.08 by Apr 11.
As ccpi will be 2.0, the SPY run will be complete by May, and TLT x 200dma, TLT is due for a strong pop on the fed rise June.
The similar chart is May-Jul 2016. The Fed meeting is Jun 14-15 and the pop is at the open the day after the meeting end or Jun 16 here. Also TLT dots below, notice the OB condition on Jun 16 and after the holiday Jul 5.
These are the runs.
First pop-
Jun 1 125 close -Jun 3 Fri close +2.50
Jun 1 125 close to Jun 16 131 open +6.00
Second pop-
Jun 24 close to Jul 5 1300 or close 136.5 +6.50
Jun 24 close – Jun 29 open +3.80
Jun 24 close – Jul 5 close 1545 +6.50


Double dip is off the table for now. The Friday up day has put an end to a double dip.
July 31 is the next candidate for SPY short. By then, SPY should be in an official bear market with 3 week down runs. The 200dma should reach 270 by end of june.
To short SPY, you need FPC+below 200dma.
To go long TLT, you need FPC + above 200dma. So buy TLT after 123 and May 14 close (second Monday) after cpi report on May 10. Sell date is 4th Monday in June or June 25.
Also weekly macd turning up for TLT but should cross in 8 weeks or
watch it here:
http://stockcharts.com/h-sc/ui?s=TLT&p=W&b=5&g=0&id=p29508740517

Last 3mo:

And bear market for SPY is about 4 months away given a 200dma at end of june (270):

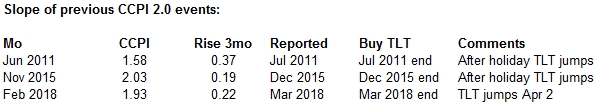
As inflation rises quickly (as it did with the tax cut in 2011), TLT anticipates by 1 month and starts to pop in the month of 2.0 or after the holidays. This will be April as CCPI last March 2017 was low (-0.073) and the average is much higher for the previous 5 years (0.12) see table-

The bold values indicate the predicted values for Feb and Mar (reported Mar and Apr). February is predicted on the high side of estimates.
Due to Fed rate rise on Mar 21, the purchase day is right after the Fed rate 1 week correction in TLT (Mar 29 close or Apr 2 open). CCPI is rising faster than Nov 2015 and there’s no holiday delay this time. TLT has an April seasonality as well due to Q2 beginning I suppose.
BUT THE KEY AGAIN IS THE FED POLICY CHANGE (FED RISE + 2.0). FED GIVES THE ENERGY TO THE BOUNCE. Notice in Dec 2015 the Fed raised rates and TLT popped right after the holidays in Jan 2016. In Jul 2011, the ‘twist’ rumors were everywhere. Hence the pop after the Jul 4 holidays in Aug.
The fed rate rise causes the TLT pop afterwards. The other rise in Jun will cause another TLT pop after the 1 week TLT correction.
Mar 21 Fed rise, 1 week correction down
Apr 2 TLT buy, sell May 30 1015
Jun 1-13 TLT rise, sell Fed Mtg close
Fed rate rise Jun 13 (Fed + 2.0), 1 week correction down
Jun 20-Jul 20 TLT rises again…
After the Sep rate rise, VIX will fall again and SPY rallies Oct 1- Nov 20. So TLT won’t be a play after the Sep rate rise. Also Dec is off as the Fed will be pausing after the Dec rise causing oil to rise rapidly thereafter.
Side Note with holidays
Order of Events with Holidays:
Fed Policy Change or Rise
Holiday
Market reaction starts the next month
