Watch for CPI Mar 13

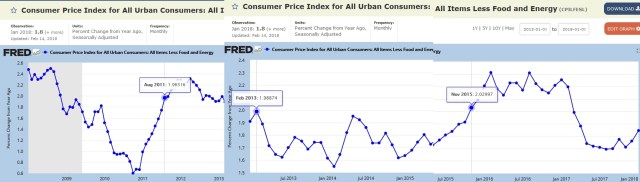
Above the most recent CCPI 2.0 events and their 6 digit CCPI numbers. In general a 1.84 becomes 1.80 and 1.95 becomes 2.0. I see a 1.89-1.92 as most likely.

Watch Mar 13 in the main text of the release:

CPI 


The statements in each BLS cpi report above are pasted below:

Aug 2011  (1.965) reported mid-Sep

“while the 12-month change for all items less food and energy reached 2.0 percent for the first
time since November 2008″


Feb 2013  (1.98874) reported mid-Mar (TLT pops Apr)

“The index for all items

less food and energy also increased 2.0 percent
over the last 12 months.


Nov 2015  (2.02997) reported mid-Dec (TLT pops Jan)

Posted in Uncategorized | Leave a comment

Best Time for TLT is Open on CPI Day 2.0+

In Feb 2013, TLT fell rapidly based on an inflation scare and had a brief rally at end of Feb. The following month,Mar, had a CPI day of 2.0 on Mar 15.  Note the opening was the best time to buy. It then surged in April the following month. The next CPI day with 2.1 will be Apr 11, 2018.

  1. If TLT falls the first week, buy on CPI day open.
  2. If not, buy 2nd to last day of the month at close.


Monthly CPI is below. A 1.95 yearly  (up +0.1) on Mar 13 and 2.15 on Apr 11 is expected:

And yearly shows a rise, Jan 1.84 :

Posted in Uncategorized | Leave a comment

Double Dip Likely (VIX and SPY 4dmaX confirms)

Always you need a fundamental driver: Fed Mtg or CPI day.

  1.   Watch for -1% down day on SPY after CPI day (Mar 13). Fed first day Mar 20 is also possible.
  2.   And watch for the 4dma- dot, the day after at close. Buy at close.

It seems that a double dip is likely in Mar (after CPI day) due to high VIX (37) on Feb 5 as stated before as well as the 7 day persistence above VIX 20.

The charts below show weakness yesterday 4dma- and VIX 4dma+ also SPY -0.6% not a good sign. VIX has been above 20 for 7 days after the peak.

Now looking for first 4dma+ around Mar 13…

See last ROC M7 event VIX below. After the peak VIX, VIX did not persist with only 2 days VIX above 20.

Compare to Jan 2016: after peak, VIX persisted 7-8 days above 20.

And a minor event (Jan-Mar 2014), VIX persisted 1 day above 20 (after the peak) :

VIX goes higher as leverage is higher than ever and VIX got very low last year with no pullbacks!

For reference SPY OHLC chart below, shows the bottom as Thu Feb 8 at close, sell point is obviously Feb 8 at close (open). It seems the sell point for these dips is always Thu at close. Mon (open) to Thu (close).


Posted in Uncategorized | Leave a comment

Oct-Nov 2014 Closest ROC -7.5

We’ve had a ROC -7.5 event…rebound now underway…4dma X 5 days ago

last time the run on spy was:

Oct 16 bottom..2018 bottom Thu Feb 8 257.50 +6% up

Nov 10 was first stop…25d later…now first stop Mar 5

Nov 27 peak price…now Mar 30

October +$11, +6.3%

November +$6, +2.6%

And now 2018:

Target for end of March:

=194/184 or 5.4% higher than now or 288 as final level Mar 29


Posted in Uncategorized | Leave a comment

CCPI 2.0 Transition (Feb CCPI strong 1.84)

As Feb CCPI is stronger than expected, a new strategy is necessary. Below are the last 3 transitions to CCPI 2.0.  When CCPI moves to 2.0, SPY stalls out after 2nd week (Jul 2011, Apr 2013,Dec 2015). Of course, TLT pops in the month after CCPI 2.0 (Aug 2011, Apr 2013, Jan 2015). Most likely Apr CCPI will be 2.0. A May pop is possible for TLT. CPI dates of interest: Tue., Mar 13 and Wed., Apr 11.

2011:

and

2013:

And 2015:

Posted in Uncategorized | Leave a comment

Oil and TLT 2016

The last transition to ccpi 2.0 was Dec 2015 with a Fed rise. TLT then made a rally

Jan 4,2016 – Feb 11, 2016. You need USO at the beginning of the trend to get it started.

On Jan 4 USO fell below the 4dma line.


Posted in Uncategorized | Leave a comment

VIX can stay above 20 for quite a while and good news ?

While it will take 42 days to wash through this from the start Jan 30, this is good news:

  1. Volatility is finally up since Aug 2015
  2. Events come in waves so the next one is within 4.5 mo
  3. Econ and gas buddy are still strong.  CCPI actually went up after Aug 2015 and UC continued to drop YoY.

Entry to market again is around VIX 26. The SPY rebound signal will be a VIX RHA close sometime March 12-onwards as VIX will rise again in early March (a smaller wave).

NO TLT as NO CCPI 2.0. After June-July, no more events this year.  Sep-Oct events are election year events except for 2014 due to ECB QE that year. Even 2019 will see a VIX 31 event in Jul-Aug.

Posted in Uncategorized | Leave a comment

VIX hits 37

With VIX at 37, recovery will be slow.  No point in SPY recovery until middle Mar-3rd week Apr. USO will also confirm at that time…

Posted in Uncategorized | Leave a comment

First VIX 21 event

Vix 21 event happens this week but ROC14 hits -5% by Thu/Fri around 268. This will be the limit as ccpi is not yet 2.0. The fall has been violent/too quick so it will burn itself out quickly.

Rebound play starts when SPY +1% on Fri or next Mon…


Posted in Uncategorized | Leave a comment

Both VIX lines rising and Emp-Popn ratio rises 1.5pts

With both VIX lines rising, a new higher base is forming for VIX for ex. 12.


Employment to Pop falls 5 pts after 2006 and regains 1.5 pts in recent years:


Fed also indicates ccpi to rise as well by April.

Posted in Uncategorized | Leave a comment