
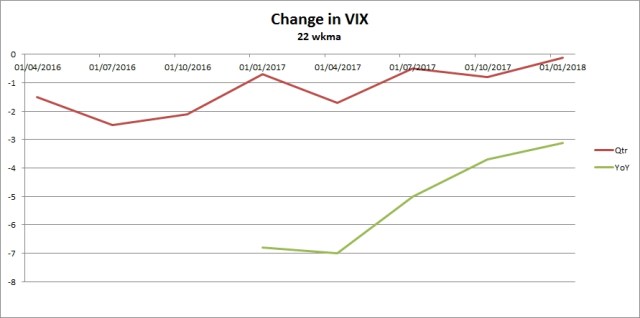
When both 15 and 22 wk lines both move up, VIX is moving to a higher base line for ex. 12.

When both 15 and 22 wk lines both move up, VIX is moving to a higher base line for ex. 12.
First, car sales/units YoY transition negative for the first time since 2006 (means a 2y countown):

Secondly, while not positive yet the UC Qtrly shows the worst Q4 performance since 2012:

BDI link:
Now that a recession is approaching…BDI can be useful and rail data (somewhat). Near term Jan shows a greater downturn MACD (-60) than 2017 (-30) , black line (21) than 2017 (150) and ROC (36) than 2017 (150).

See 2007-2010

And the last 5 years…40 wkma seems to be useful..

Just ROC;


And rail data…


The YoY growth in car units sold by quarter shows decline since Q2 2016…
Recession is close when this happens.
VIX base is rising even though SPY has also been rising. VIX 15wkma has crossed the 22 and VIX ROC YoY is also due to X zero. Last Jan 2017 VIX was falling rapidly -50% YoY.
But this year its rising in Jan 2018. Best days of SPY are nearing their end …

Two charts from the talk (1st chart past growth):

And the future growth:

I see a ‘dark age’ ahead. The above chart shows it as well…

https://www.hussmanfunds.com/wmc/wmc170508.htm
“We presently estimate that the total return of a passive, conventional portfolio mix of 60% stocks, 30% bonds, and 10% cash will hardly exceed 1% annually over the coming 12-year horizon.”
This implies a very rough road for S&P500 in 2019 and 2020. Recovery for market was 4.5 years from 2009-mid 2012 (a 16.8% annual average return), but this chart implies a 10 year recovery period 2020 (low) – 2032 (recovery point)) or a 9.9% annual return before S&P hits 3000 again. The low return value means a longer period to recover the previous high.
The best recession indicator is the 10 year-2 year treasury rates, (now 0.56). After so many years, recession is finally upon us. I believed recession was impossible without inversion and indeed it was but NOW IT WILL ARRIVE! See below on the way to recession as inversion is 1 year away.

When the first inversion takes place, the Fed pauses THEN they drop rates when the inversion reverses.

The fed rate and 2 year rates are also converging to 1.85 which implies the pause in Dec 2018 for the Fed at 2.1 as stated in an earlier post. Charts for the last 5y below:

Links are under Reference:
10 year rate minus 2 year rate
And 2 year rate here says rates are going to rise quickly as inflation does-

For further reference, here are top performing Treasury Funds 1y performance from above link:
http://etfdb.com/type/bond/treasuries

The effective tax cut for the first year 2018 (declining every year after) boosts real income by 2.2%. The tax cut effect pushes up inflation and real income for 6 months then falls off. So I expect 2.0 core inflation sooner by May. The transition to ccpi 2.0 by May will make 2018 very different from 2017 (when ccpi fell below 2.0 in May).
Below you can see transitions to ccpi 2.0 (2011-2012, 2015-2016):

Note also weak economic growth and lower ccpi from 2008-onwards (mostly below 2.0) compared to 2004-2007 (above 2.0).
The last equivalent tax cut was 2011-2012 when payroll taxes were cut 2%. CCPI rose during this 6 month period. See below:

SPY will rise 2-4% by Feb and then go sideways with rebounds after pullbacks (SPY +10.5% for the year). SPY will have pullbacks starting in June when ccpi 2.0 has been reached.
TLT will do ok for first 6 mo and badly after 2.0 ccpi. (TLT +5% for the year)
Oil MACD will also go negative by Feb-Mar.
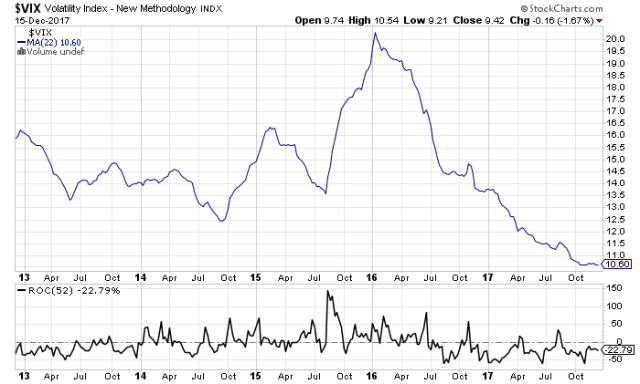
Good news is that it has bottomed out and has nowhere to go but up!
ROC shows above the line Jan 2014-Jul 2016. And from Jul 2016 below the line. 10.60 is also at the bottom historically.
The change in VIX below shows VIX turn coming:
Link on the web site:
http://stockcharts.com/h-sc/ui?s=%24VIX&p=W&b=5&g=0&id=p29296422935
Inflation below 2.0:
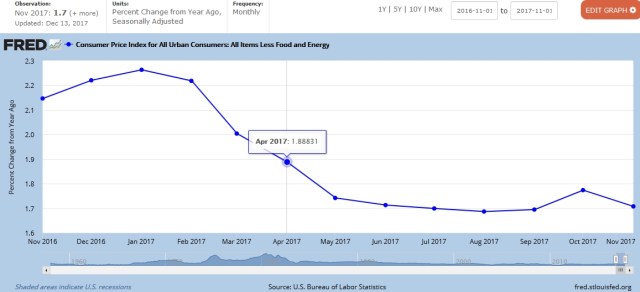
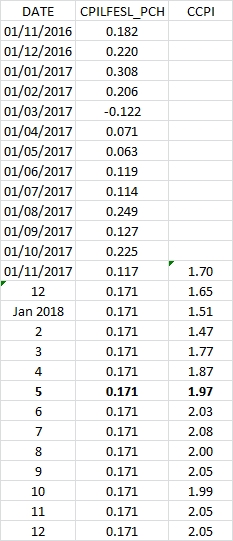
Inflation fell in Apr so SPY got an extra boost through December. BUT next year ccpi reaches 2.0 by Jun fed meeting as I created a spreadsheet to show
(assuming 0.171 monthly inflation, average of the last 2 mo):
On Nov 28, the Fed said low inflation is transitory…
Also as oil starts to fall in Feb, ccpi will start to get an uplift. CCPI 2.0 by June means market will be afraid of more rises to come and hence react. Years with ccpi 2.0 have at least two vix 20 events and have lower returns. Generally, the higher the inflation the worse the performance of SPY. CCPI 2.0 by June does not favor TLT however (after that point).
Problems for SPY 2018:
SPY 2019:
