Vix will rise to a base of 12 next year 15 wkma (week moving average).


Vix will rise to a base of 12 next year 15 wkma (week moving average).

Real personal income was increasing at 3-5% between 2005-2008 (a good economy). Now it’s 1.3%. It’s the weakest value since early 2014.
Oil prices fell rapidly in 2014-2015 increasing real income. As oil prices now rise, personal income has been falling again. Hence, the Fed futures show increasing fed rates as Yellin/Powell prefer lower oil prices in order to boost real income.

Oil will retrace to $68 and then turn over in April-May bottoming Jan 2019. This will give a boost to ccpi and Fed will raise this Dec 2017 and once more, Dec 2018.
S&P yearly returns follow a normal distribution of sorts. Stock returns follow a surge year followed by 2 ‘fall off years’. The surge years seem to be right after elections (2009 and 2013 were boosted by QE). The 2017 surge is the weakest of the 3 actually.
The VIX also rises for 2 years after the surge!
The 2013 stock surge (+32.39%) wore off quickly into late 2014 (+13.69). So the SPY surge of 2017 (+18%) leads to a 2018 return of +10% and a 2019 return of 1%.
Below is the distribution of S&P yearly returns. FR+ refers to the Fed raising rates. The fall in 2020 should be 62% in fact by Fibonacci numbers (-37% in 2008, another one) but I don’t want to scare anybody !

Side note…boomers working more than ever…and demographic decline.


And of course, declining births over time…

From title, economic boost from 2016 to early 2017 has worn off. The boost from 2013 stock rally wore off into 2014 and 2015.
See below the surge of 2016 and early 2017 is over. I’ve blown up the area from 2011-on:

Clearly the growth surge of Q1 2017 has worn off already. See how quickly the surge wears off in 2Q-3Q 2017.
A more reliable indicator is the one the Fed uses or ccpi. It has been below 2.0 since March indicating a weak growth economy (similar to 2013-2015). This is certainly not 2005-2007.

Also for info GCPI…high inflation 2005-2008…and below 2.0 for 2013-2016.

The last recovery rally will be the end as the Fed is now raising rates and delinquencies will start to rise late 2018 – early 2019. When delinquencies rise, Fed will go flat in policy and USD will start to fall.
No pullback or correction occurred in Sep-Oct. This would’ve increased the VIX to a target 16+ level by end of December. It hasn’t happened. The VIX is very low now and has bottomed at 10-11.

| End of Run | VIX | ROC14 | |
| 15 wkma | 14 day | ||
| Oct/2013 | 14.5 | -4% | QE, Debt limit crisis |
| Feb/2014 | 14 | -5% | Taper |
| Oct/2014 | 12.5 | -7% | Oil falls rapidly |
| Jan/2015 | 15.5 | -4.50% | FPC 0 TLT +++ |
| Aug/2015 | 13.5 | -10.00% | Threat of Fed increase |
| Jan/2016 | 18 | -10.00% | Fed Increase, also Jan 2008 -10% |
See the runup of VIX in the 2005-2009 period (the bottom is 10-11):

VIX has nowhere to go but up as it has bottomed. Expect 12-14 range of VIX 15wkma next year as the Fed will keep raising rates and the USD strengthens.

In the last week, Fed Futures rise rapidly indicating a more aggressive Fed in Dec!
As inflation is weak, the economy is also weak as seen in 2014.

Throughout 2016, ccpi was 2.0 and economy was relatively strong. This was due to low oil prices from 2014-2015.
Starting at the beginning of 2017, the economy has weakened again. This calls for lower oil prices again to ‘rebound’ the economy.

VIX had a sustained 15 in April of 1 week and a smaller one day in August. This case would be ideal for end of December into early Jan.
See Nov-Dec 2014 and Nov-Dec 2015 below:


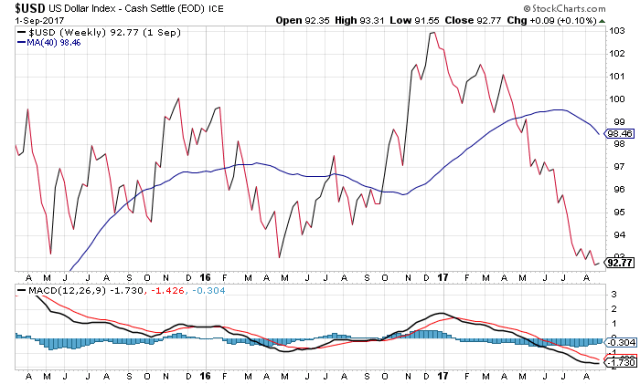
As stated in June, there will be no run (-10%) in Sep-Oct although a 5% pullback is possible over budget issues. The real reason for USD weakness is some inflation in the euro zone which has caused the euro to be overbought and the USD to be oversold. BUT as you can see above, the macd shows a return to USD bull again in 1-2mo. USD has been driving SPY of late due to the ‘speed’ of movement. Normally, it’s not the leading indicator but rather oil, and vix.
Due to USD weakness, SPY has run up and up but this is also good. The expected correction in January is now 12-15% . Oil will also get very low indeed by end of Jan 2018.
The low oil prices in Jan/Feb will also give an opportunity for a quick retracement in Feb-Mar (see Sep-Oct 2015 and Feb-Mar 2016).
Of the 3 Fed rate rises promised this year, two have been delivered. Now December is left. The next correction will be January after the rise in December.
For now a “pause”, SPY will rise even higher so correction in Jan stronger.
OFC-
Oil: down (below 40wkma, macd moving average crosses over)

Fed Change: Dec
Calendar: January (it will be 23 months since last correction)
AND core inflation will be rising from 1.7 to 1.9 perhaps 2.0
