“Individual Level” Recession Chain of Events

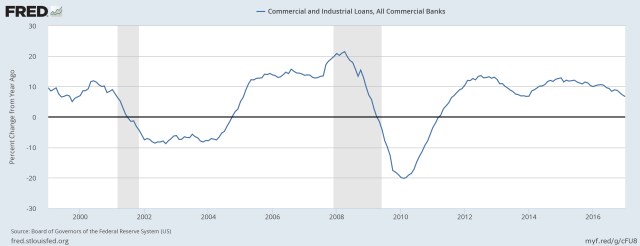
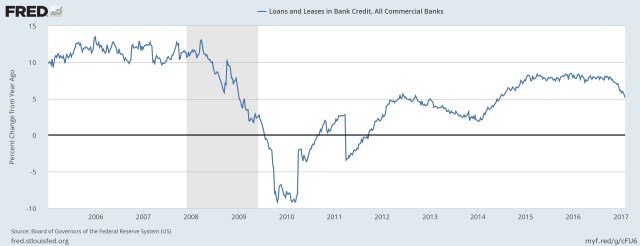
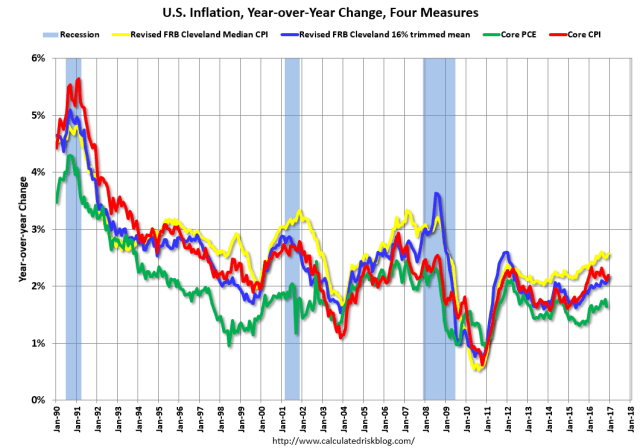
As discussed below, the macro adjustments for the recent recession are shown.  From an individual level, the chart below explains it better-

recession-diagram

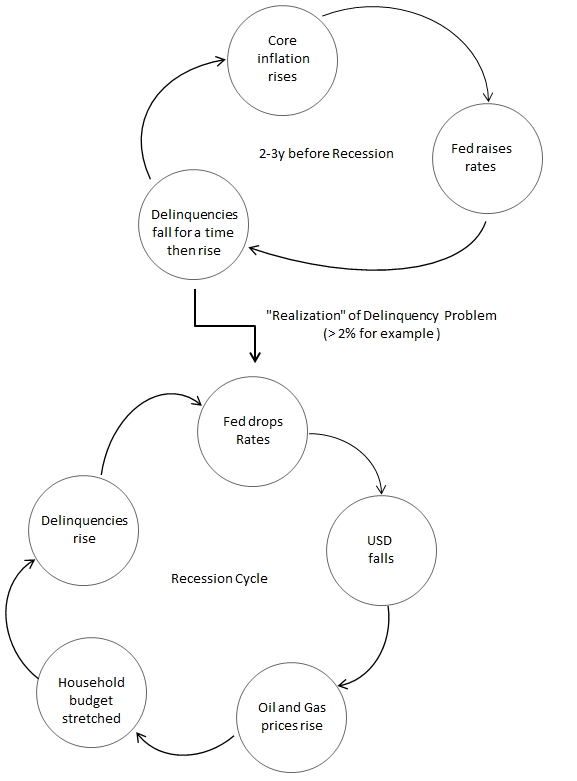
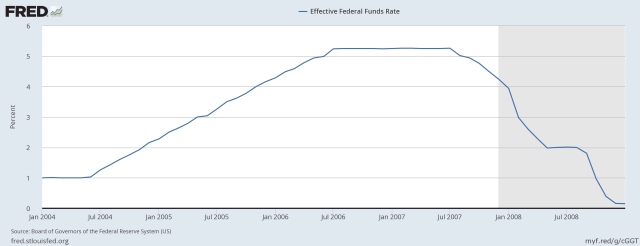
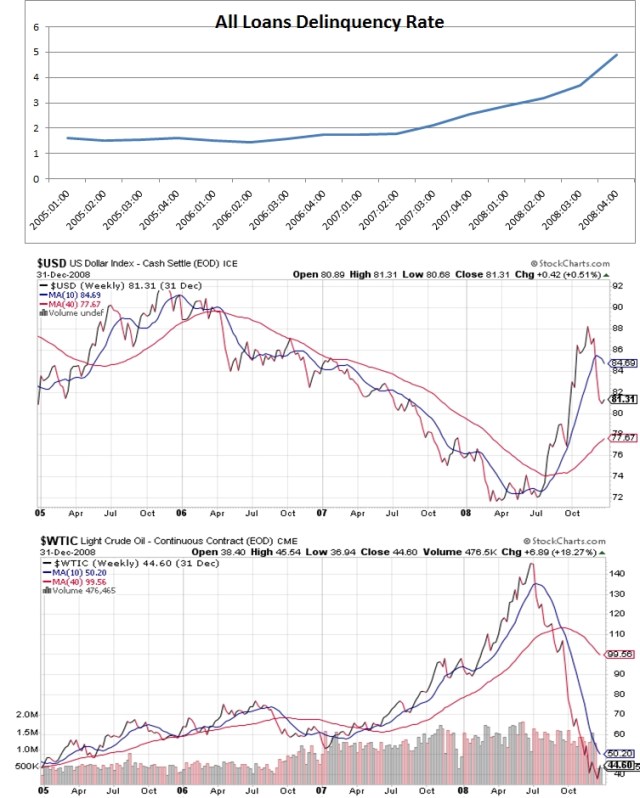
Of course, we are in the 2-3y lead up to a recession at this time. But this is good news as rising rates leads to rising $USD and stalling oil prices as shown by MACD below-

1

The TLT: $WTIC chart has X already … an early sign of switch to risk off:

2

If oil X the 200dma by May, then a July 10% correction is possible.

BUT very unlikely,

Jul 2011 (GCPI 3.5% Q1 GDP -1.5%), and

July 2008 (GCPI 4.9%, Q1 -2.7%)

had high inflation/weak economies.

Economic growth Q4 at 1.9% and GCPI 2.1% now argues for a Sep-Oct run (July-Aug 2014 had a SPY fall of -2.5% only). On the plus side SPY will be very overvalued/overbought so a 10% correction is expected starting Sep 25.

Posted in Uncategorized | Leave a comment

OFC Trading Model

Once oil rolls over the model resumes.  Why oil?  Oil is the global liquidity indicator and also drives inflation. The best time to profit is when the Fed “shakes the tree.”


The indicators for the model (OFC) are:

Oil 200dma +-          (Oil above or below 200dma)

FPC + – NC Zero        (Fed Policy Change : plus, minus, no change, zero bound)

Calendar after holidays (Jan, Sep-Oct)


Best conditions to short SPY in order are-

  1. Oil 200dma- , FPC +                                      Sep-Oct 2014, Jan 2016
  2. Oil 200 dma-, FPC – (recession year)         Aug 31-Oct 21 2008
  3. Oil 200 dma+, FPC- (recession year)         Jan 2008

No Go SPY short conditions-

  1. Oil 200dma+ , FPC +                                      2006, Jan 2017                                               (SPY can still fall but only 2-4%)
  2. Oil 200dma+, FPC NC                                    Jan- Sep 2007

TLT long conditions-

  1. Oil 200dma-, FPC Zero                              Nov 2008 (after SPY crash), Jul 2011, Jan 2015, Nov 2019/2020?
  2. Oil 200dma-, FPC +                                    Feb 2016 (after SPY -10%, 2 wks only)

In general, the USD trend precedes the oil trend by 3-6 months. So USD can be used as a leading indicator.

Posted in Uncategorized | Leave a comment

USD strength since Oct stalls oil momentum

2

1


Soon USD rise will cause oil to roll over.  Frexit threats will weaken Euro as it did UKpound.  An oil rollover usually occurs in July:

July 2008, July 2011, and July 2014.

Relationship oil to SPY ROC14.  See below the ROC14 for SPY hits 7% or greater after oil falls!

oil-and-spyroc


Posted in Uncategorized | Leave a comment

Recession Chain of Events

  1. Inflation rises
  2. Fed raises rates (2005-Jul 2006)
  3. Highly indebted delinquencies start to rise (2006-2008)
  4. A breaking point arrives and Fed starts to drop rates RAPIDLY (Sep 2007-Dec 2008)
  5. USD falls rapidly (2007-Jul 2008)
  6. Oil and commodity prices spike ($70-$150) causing a recession and economic contraction (Jul 2007-Jul 2008)
  7. Spiking oil prices lead to a deflationary collapse (Jul 2008-Dec 2008)
  8. USD rises in response to deflationary collapse (Jul 2008)
  9. QE follows as a form of monetary stimulus and USD starts to fall again (Jan 2009)

Notice how slowly Fed raises rates from 2004 (3.5 years) and how fast they fall from Sep 2007-Dec 2008 (1.25y)!

fredgraph3

From 2005-2008:

2006-2008-fed-rates

Or easier to see the Y/Y change in delinquency rates:

all-loans-delinquency-rate-of-change-q316

delinquencyusdoil

Also VIX rose through 2007


Another related measure, check commercial and industrial loan growth for the last 3 recessions to see the effect of credit contraction or merely slowing:

comm-and-industrial

Or all loans and leases from 2005-2017:

yryr-growth-all-loans


Posted in Uncategorized | Leave a comment

2006 Not Apt for SPY pullbacks

2006 had rising rates and inflation as now BUT most of 2006 had risk on.  Therefore any pullback in SPY was very short followed by a rally. Formula is Risk Off + FPC.  But for 2006 it was Risk ON + FPC.

Risk ON for most of 2006-

risk-on-2006-tlt-spy

SPY pullbacks 2-4% ONLY:

1


Now I see that Risk ON/OFF may switch back and forth every year in February as inflation and fed rates rise.

If we go back to 2013-2016 to understand relationship of bouncing oil prices and fed policy:

2013    Risk ON                   Oil UP    GDP 1.7%

2014    Risk ON to OFF     Oil DOWN    GDP 2.4%

2015    Risk OFF                 Oil DOWN    GDP 2.6%

2016    Risk ON                  Oil UP    GDP 1.6%

2017    Risk OFF (starts Feb) Oil DOWN    GDP UP

2018    Risk ON (Feb)          Oil UP     why?

2018 has oil going up as oil gets too oversold and rebounds.  Yellin also likes the lower oil price as it boosts GDP. BUT by 2019 delinquencies will have risen too far and NYSE margin debt will implode…

2019    Risk Off                      Oil DOWN       GDP NEGATIVE

Core inflation will remain above 2.0% for this period so TLT not a play until mkt crash 2019.


Posted in Uncategorized | Leave a comment

Delinquencies Falling at a Slower Speed

all-loans-delinquency-rate-of-change-q316

Rate of change in delinquencies is at the same level as early 2006. It should cross 0 this year.  In 2006 PE ratio was much less and the SPY was on a tear (+15%) so it’s only similar in that the underlying debt market is beginning to show stress . Also the Fed was much more aggressive then, raising rates to 5% by August. This year Fed is due to raise rates to 1.5%.

Why 11 years to recession this time? Inflation was very low for a long time (2009-2011,2013-2016) leading to a drawn out recovery. So perhaps it will take longer for recessions to take place than in the past.

Reasons for recession 2019:

  1. Unemployment claims still falling so no sign of recession next year (2018)
  2. Car sales will cross to -ve growth this year and its usually 2 years to recession after doing so
  3. All loans delinquencies will cross  to +ve Yr/Yr which is again a 2y clock (see above)


Side note: Millenials have no money. Also worker starting salaries are higher than those from university.

college-cost

Also too high expectations right now…

Are Expectations Too High For Trump?

Also from pragcap-

Modern Finance is (Still) a Rip-Off

It gets worse though. You have to keep in mind that most financial advisers are charging about 0.9% these days for what is basically high fee asset management using underlying mutual funds or index funds with an occasional dollop of financial planning. So, on top of the 0.66% in fund costs many investors are incurring another 0.9% in advisory fees. Granted, this probably pays off for many investors who actually need the coaching and structure implemented by a good advisor, but 1.56% of your assets per year is an egregiously high cost for what is essentially the equivalent of having a personal trainer for your portfolio.


Posted in Uncategorized | Leave a comment

Jan Bankruptcies Up …first time since 2010

bankruptcies-turn

Good Link-

Restructuring Boom Business 2017

1


Estimates of Mortgage Volumes show decline this year

purchase-volume

Inflation Chart shows rising this year…

inflationdec2016

In 2007, delinquencies started to rise. So far rates are still declining but should show rise next year 2018.

Delinquency Rates

delinquency-rates

Since 2006,

5


But Commercial Bankruptcies are up 26% and Comm and Industrial Loan Delinquencies rising (rate is up 76%):

3

Posted in Uncategorized | Leave a comment

When the Fed shakes the tree…

The best time to profit is when the Fed changes policy and the market reacts to it.  All other times have low returns or are ‘noisy’. Those that are always invested waste too much time and energy for low returns. SPY short is the only policy now that inflation has become an issue. TLT will be a play in Nov. 2019 after the stock market crashes 40-50%.

Car Sales show 2y to recession:

fredgraph

Average annual car sales show no growth…a condition 2y before recession.

UIC claims need to rise Y/Y which they aren’t doing now. They probably will start to rise next year as Fed rate will be higher 1.5 and ‘base’ volatility will rise to 20 (currently it is 12). Most likely recession start is 2019 as unemployment claims start to rise a full year before the recession year (2018).

Because inflation has been so low for so long, it will take 11 years to get to the next recession from 2008.


risk-on

Still Risk On…next chance to short is after FPC Jun 14.

List for June FPC:

  1. VIX reaches 15
  2. June gas monthly shows < 1% growth (related to oil price but chk also)
  3. Gas Buddy should show decline as well
  4. If the vix 15 starts on Jun 26, the idea is the ‘3 week rule’ or short until Fri., Jul 14 cpi day. The 3 week rule is to short for 3 weeks or until cpi day. In July they most likely will coincide.

The closest gas change environment is 2007 where may +ve and june -ve..

fredgraph2

Posted in Uncategorized | Leave a comment

S and P 500 Bubble Territory

recession-coming

Recession 2001, 2008 and 2018…

s-and-p-bubble-territory


Posted in Uncategorized | Leave a comment

Feb Off….June-July after next FPC

Gas Buddy Rises So Leaning to SPY flat or more likely upgas-buddy-turns

Also:

The Fed: Fed to hold interest rates while Congress debates stimulus

Budget settles by May and by then charts should show risk off. With FPC in June, expect a correction of SPY -8%- in Jun/July. Short SPY in June/early July when VIX 15+…


Posted in Uncategorized | Leave a comment