Most Likely No FPC

Most likely there will be no FPC (Fed Policy Change) on Sep 21.  Yellin’s comments of a rate rise this year imply a Dec rate rise not Sep.

The market will still go down in October due to the election but not enough to justify a play. A lack of Sep FPC  leads to the SPY short / TLT hybrid strategy on Jan 2 after rate rise in Dec.

Posted in Uncategorized | Leave a comment

SPY short only strategy if FPC Sep 21

As in Oct 2008, liquidity issues will contain the rise of TLT until after the election. This leaves the SPY short strategy for Oct 3 if the Fed increases rates Sep 21.  Sell SPY shorts 2 weeks later on Friday open/close.

TLT may be a play mid-Nov if SPY falls more than 25% from the high.

The hybrid SPY short / TLT strategy would apply in Jan 2017 if FPC delayed until Dec and SPY falls 10-15% (doesn’t crash more than 20%+).

Posted in Uncategorized | Leave a comment

Alternate SPY/TLT strategy

1

Going back to January of this year when there was a FPC on Dec 17…AND TLT is correcting down now so a relative bargain.

When the FPC occurs in September, the idea is to:

Oct 3 at open buy SPY shorts

Oct 7 at open/close sell SPY shorts

Oct 10 at open buy TLT

Nov 10/Nov 11 at open/close sell TLT

The reason is that SPY corrects quickly down the first week and TLT THEN moves up slowly for the following 5-6 weeks or just after the election. The idea is to sell TLT on the Friday of the 2nd week in the following month (most likely the open).


Posted in Uncategorized | Leave a comment

Greatest Crash occurs first 2 weeks of the following month after a rate rise

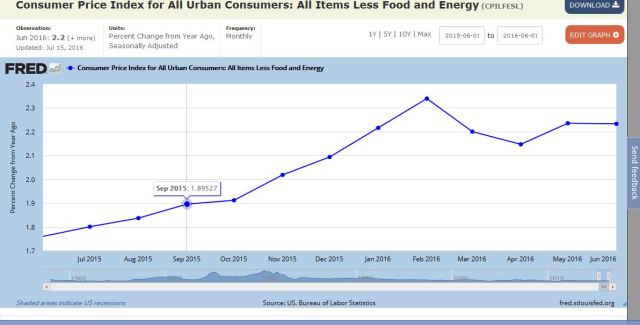
After June FMtg, SPY rebounded quickly as there was no Fed Rate Rise. The July 27 meeting also had no rate rise, so we wait for the next Fed Meeting Sep 21 (cash positions). As ccpi is 2.23, they can’t keep delaying it. So Sep 21 should be the rate rise as FPCs occur in Sep.

ccpi


The plan is to short SPY on Oct 3 following the Fed Mtg when SPY RHA and the Fed has executed a rate rise. See Dec/Jan this year after Fed Rate Rise in December when the greatest crash occured in the first 2 weeks of the following month (Jan).

Dec-Feb 2016:

2

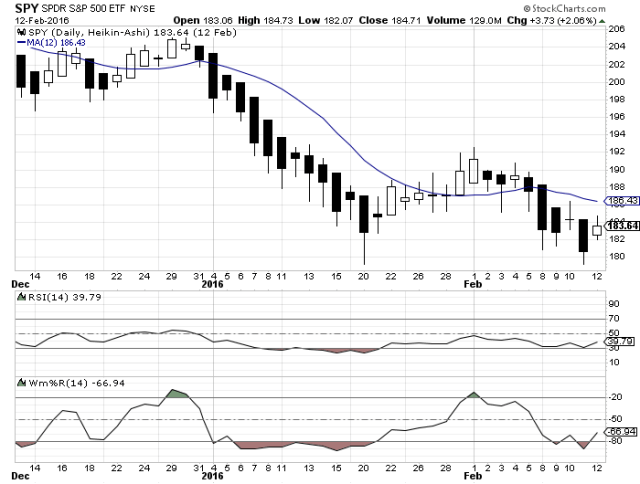
Plan is to hold through the election until Nov. 15-18. SPY short is favored over TLT long until SPY falls 20% as the bond market expects rising rates until then.  On the first SPY GHA after the election, sell the shorts.

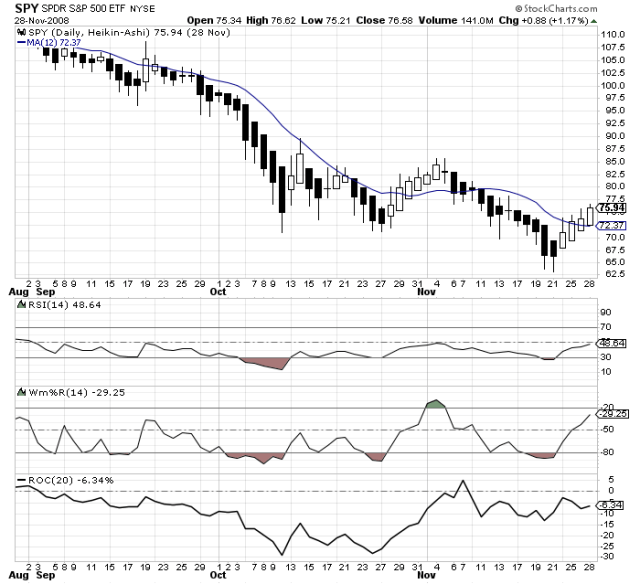
In 2008 (same ccpi enviornment), note that after a fed rate rise in Sep, the greatest crash occurs in the first 2 weeks of the following month (Oct). From Oct 1 at 98, SPY fell to 66 by November, a -33%. You would’ve missed only 5 points (103 to 98) but received the lion share of the fall.

2008 Sep-Nov period below…

1


On Nov 17 (CPI announced at 0830) check that CCPI > 2.0 and TLT GHA, if so buy TLT.  Sell TLT before Dec Fed Meeting. This would be the greatest TLT run this year!

If ccpi < 2.0, hold off in cash for Jan. TLT may still go up if ccpi will be under 2.0 but I prefer not to buy tlt when ccpi < 2.0. In 2008 and 2011, ccpi was 2.0+ and remained high.  Both years had the best runs for TLT.  When ccpi below 2.0, TLT has lacklustre performance over 1-2 mo time frames.

Next year on Jan 2, SPY long will be the new position as the Fed will announce new policy in Dec (most likely 50bps drop).

It’s all about the Fed Policy Change (FPC): Jan, Jun or Sep!

2010 Sep QE, ccpi 1.0

2011 Sep Twist, ccpi 2.0

2012 Sep QE starts, ccpi 1.9

2013 Jan QE starts, Jun Taper announced, Sep debt crisis starts

2014 Jan Taper Begins, ccpi < 2.0

2015 Jan Taper off

2016 Jan Int Rate Rise, ccpi > 2.0


The slave predicts….the king reacts.

Posted in Uncategorized | Leave a comment

TLT Jul 29 or Aug 1 GHA will be the buy…

2

and TLT…buy first green (TLT), green (VIX) and red (SPY) after Fed Mtg Jul 27 this year (Jul 29 the Fri or Aug 1 the Mon).

in 2008 similar, Aug 5 was the Fed meeting. Note Aug 7 the bull began with GHA TLT:

1

Posted in Uncategorized | Leave a comment

Leading Indicator for TLT

This chart is good as it leads an entry for TLT by 1 month.  It has now crossed below indicating a bear market for a few months. So after a X event, watch for an entry opportunity when Wm turns red.

Leading Indicator for TLT

Posted in Uncategorized | Leave a comment

Inflation Accelerates…recession and crash this year!

Inflation accelerates

This chart means recession for sure this year and a major market crash 35%+.  The Fed will have to raise rates again most likely in June meeting which will be the last rate rise for the year before they drop again when stocks crash in September.

Posted in Uncategorized | Leave a comment

TLT to SPY pulls back as expected

The SPY market will stay in a trading range until Jun/July where it gets OS again. TLT will get OB briefly in July.  When it pulls back in July, the buy will take place.  TLT will then rise from Aug to Sep / 6 weeks. The biggest crashes always occur in the fall Sep-Oct-Nov and bottoms just after with the election! This is a recession year so the SPY market falls a minimum of 33%.

TLT always has runs in August or September when the Fed is on a tightening cycle.

TLT to SPY Feb 17

Posted in Uncategorized | Leave a comment

3 Months of Rising Claims fastest in 5 years

UIC Claims rising soon 0X

YoY chart is above. No zero crossing yet BUT a good sign that unemployment insurance claims have leveled and are no longer falling.

Month over month chart is below. It’s the longest 3 month period of rising claims in the last 5 years…

Longest 3mo period


When the YoY (year over year) number at the top crosses +20%, it’s a sign that you’re in recession or just on the cusp of it.  SPY falls average 35% in recessions…


Posted in Uncategorized | Leave a comment

Inflation Peak will be July-Aug…next opportunity July

Idea is to play 1st round TLT starting mid-July when TLT RWm and exits. First sell will be Sep FedMtg followed by another buy Oct 31/Nov 1 and sell Dec. Below are ccpi and TLT in 2008. The pattern is the same (rising inflation and Fed rates).

CCPI will start to fall in Sep. So I don’t anticipate ccpi will fall below 2.0 by then but rather in Nov time frame. When it does finally fall, TLT will pop significantly as Fed will be loosening policy. Peak inflation will be Jul-Aug and will fall in the Fall. SPY will be crashing and Fed will be loosening policy (a wonderful environment for TLT). TLT will remain a coiled spring (Feb-Jul) until Fed starts to lower rates again.The Fed must drop rates in the Fall before starting QE in Jan 2017.

TLT 2008.png

Posted in Uncategorized | Leave a comment