Buy TLT

The VIX has turned so buy TLT. VIX is number 1 indicator.

SPY MACD weekly has also rolled over. $WTIC rolled over at end of January and leads SPY by about 6 weeks. TLT:$WTIC crossed 2 weeks ago. Gas buddy turned over last week and is falling rapidly.

I anticipate 2 months of falling SPY followed by a new Fed stimulus program end of April.  Current Fed program has petered out. This year is similar to 2012 except weaker.

Posted in Uncategorized | Leave a comment

GDP and CESIG show turn

As GDP and CESIG have turned negative as well as recent UI claims report, SPY is a sell.  I have sold and will buy SPY only when it returns to bottom or near bottom of BBd. It has exited OB on the daily chart.   SPY is of course the only uptrend.  The Fed will continue to support the uptrend of SPY through sequestration and debt limit issues.

The bottom of BBd is not that far at 144.x

BUY THE DIPS.

From

Fear & Greed Index Showing Signs of Extreme Greed

Extreme Greed indicator

Posted in Uncategorized | Leave a comment

Buy SPY As Gas Buddy Now Confirms

Gas Buddy Takes off 1c per day

Gas Buddy now finally confirms that the economy is recovering.  The Fed gooses the stocks and corporate/baby boomer spending picks up (tricklism).  http://www.bullandbearwise.com is bullish as well.  Gas buddy should rise to $4 per gallon by April.  However, SPY top may be May as Fed is also looking to lower unemployment rate to 7%.

Yen should be sold completely.  As the yen falls further say 10%, the S&P 500 will rise 7.5% or 160 by March/early April.  Key pairs are SPY/Yen and Euro/Yen.

Inflation should rise to 3.x by April and unemployment should fall.

Posted in Uncategorized | Leave a comment

Sell Yen today or by Friday

Once again cash is best.  It is a very uncertain period.  When you can’t see a trend, it is best to stay out…cash (Trend Commandments by Covel).

Now of course SP500 is an uptrend.  However, gas buddy is still weak and CESIGUS has turned down to 0 (downtrend in growth).  I would prefer to see life in CESIGUS and gas buddy before entering SPY.

Posted in Uncategorized | Leave a comment

Transition to risk ON/OFF best time

The best time to profit is when there is a transition from risk on to off and vice versa.  I anticipate the next transition to risk off in May or June when inflation ticks up to 3.x level and economy shows signs of stalling.

CPI Econ Mode
Fed 1.7 low ON

You can see the ‘stalling/transition’ point with:

1) slope of the VIX

2) at least 3 months in risk ON

3) ecri 13 week change is turning

4) cesig10 has peaked and is rolling over

5) inflation in 3.x range

Remember stall speed does not entail a slowdown or recession when the Fed is ‘on’ mode.

For a short-term play, I expect a rebound in FXY to the 50% BBd level when it will be a good time to sell.  For all else, cash is best until a pullback to the bottom BBd SPY around 140-141 mid-late Feb.

TLT has already reached 50% BBd level and has been sold.

Posted in Uncategorized | Leave a comment

BB weekly trends

Trends show:

1

Yen Oversold on short-term basis with a 1 month rally perhaps to end of February/early March.  This is a temporary safe-haven play.

Gas Buddy is falling slowly as demand is weak until resolution of debt ceiling.

The only strategy is to buy on pullbacks to the BB bottom with the uptrend in your favor.  From a ‘theory’ perspective,  the debt ceiling debate will cause a short term correction and most likely be resolved in the first week of March with a pullback of SPY in late Feb.  In this environment, buy SPY on any pullbacks to bottom of bollinger band.

This occurred in the 3rd week of December 1 week before the deadline. Remember Congress has stocks as well so they are also paranoid of having any crashes/severe corrections!  A small correction to 141 can be tolerated for political reasons.

CPI is low at 1.8 (Nov) and in a downtrend!  Today the December CPI will be announced. This is weak with plenty of room for stimulation until the 3.x range.  The Fed has discussed stopping the mortgage purchases but not the treasury purchases! I suspect they will delay any additional action from 45B/mo until the debt ceiling is resolved in early March.

Posted in Uncategorized | Leave a comment

Themes for 2013: Yen and Euro

The yen will fall although may rebound shortly.  The Euro will rise through the year.

These two opposing forces will keep the USD in a tight range so SPY, commodities, etc. and TLT will also be in a range say 140-150 on SPY.  Perhaps European stocks will do the best this year.

Inflation will remain subdued until the Euro tops out and the USD starts a downtrend perhaps after the debt ceiling resolution.  As Q1 GDP will be weak at 1.x%, the Fed will increase QE after debt ceiling resolution if the economy shows no pickup after resolution.  This will most likely cause a downtrend in USD.

When the weekly FXY exits RSI to the upside…buy for a short-term counter rally.
http://stockcharts.com/h-sc/ui?s=FXY&p=W&yr=1&mn=0&dy=0&id=p37396990940


Posted in Uncategorized | Leave a comment

Fed Driven Rally…Fundamentals weak

There’s no doubt that rail traffic and other indicators show a weak economy.  Later this year the tax increases will also bite. But I like this link from dshort.com on business cycles and his conclusions:

If you have studied the evidence, you will see that recessions usually involve the Fed!

You might also have noticed that business cycle peaks do not typically come from a problem of “stall speed” but one of excess stimulation.

1

2

http://advisorperspectives.com/dshort/guest/Jeff-Miller-130111-Business-Cycle-Forecasting.php

Excess stimulation means inflation. You can see the rising and falling of gas prices as a sign of this stimulation.  I must agree with dshort as 2008 had high inflation at 5% and 2011 (3.8%) also had a high inflation rate which almost fell to recession.  We are now entering a new excess stimulation period (CPI at 1.8% leaves lots of room for stimulation) which should lead to inflation later in the year after the debt ceiling is resolved.  Stimulation here is not lending but rather driving cash into the equity markets with a knock-on of increasing corporate and baby boomer spending.

The cycle as I see it:

1) rising inflation

2) inflation level that causes economy stall

3) Fed removes stimulus

4) inflation falls

5) economy falls to recession

6) Fed adds stimulus

1) rising inflation

So clearly the inflation cycle must rise to a high level before a recession can be entertained.

Given the overvaluation levels of the stock market which will be driven higher by the Fed, the bubble will burst likely this year when the Fed removes its ‘excess stimulation.’

Posted in Uncategorized | Leave a comment

VIX has turned. Sell TLT and stay cash.

BBd means Bollinger Band daily             BBw means Bollinger Band weekly

The number 1 is VIX and it has turned down.  It is time to go to cash and sell TLT.

This is a very uncertain period so cash is best.

The USD BBw is showing a downtrend since October.  The downtrend is weaker than before due to ECB and JCB asset purchases.  Gold will not perform well.

The risk is now ‘ON’ unmistakably.  However, as the VIX may fall 3 points, the upside is limited (152-155) while the risk clearly is on the downside with the upcoming debt debate.  In March or April the market will top after debt ceiling resolution.

Daily MACD shows a near-term top-

http://stockcharts.com/h-sc/ui?s=SPY&p=D&yr=1&mn=0&dy=0&id=p92709496383

Weekly MACD indicates 8-12 weeks left in this rally (late Mar-mid Apr) :

http://stockcharts.com/h-sc/ui?s=SPY&p=W&yr=1&mn=0&dy=0&id=p31353048840

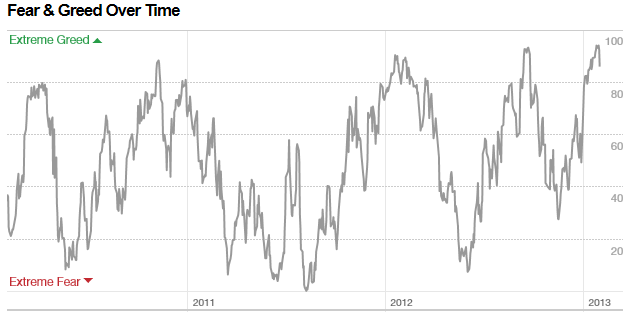
According to Kimble, we are at or very close to a top. I like this:

“VIX is a much better tool at market bottoms than highs”

http://advisorperspectives.com/dshort/guest/Chris-Kimble-130111-VIX-and-Inflows.php

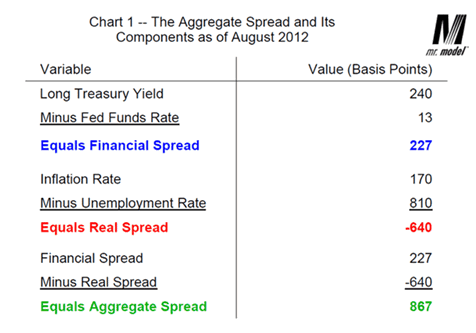
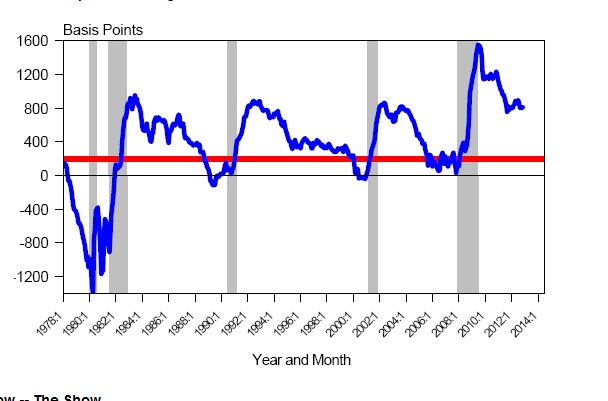
Gary Shilling also states risk ‘on’

http://www.businessinsider.com/gary-shillings-2013-investment-themes-2013-1

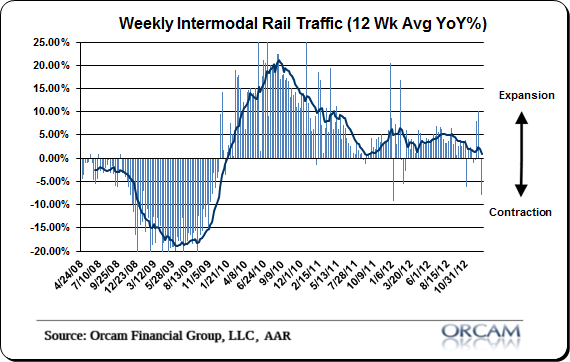
While financials are doing well, the real economy has growth issues.  Even though there’s liquidity for equities..commodities are struggling and rail traffic growth has stalled.  Gas buddy also shows flat to falling trend so this is a Fed driven rally for sure.

http://pragcap.com/wp-content/uploads/2013/01/rails1.png

Six charts showing slow growth-

http://www.businessinsider.com/rosenberg-6-charts-us-economy-2013-1

Car sales were up no doubt in Q4 but still low growth-

http://research.stlouisfed.org/fred2/graph/?g=euI

Unemployment claims looks like they’ve bottomed-

http://research.stlouisfed.org/fred2/graph/?g=euJ

Posted in Uncategorized | Leave a comment

Buy TLT and QE4 failing

QE is failing as all CB are increasing assets.  The USD is rising against expectations of QE.  Clearly the Fed bought too high.  They should buy low!

I recommend TLT highly at this point.  The market (SPY) faces:

1) OB condition

2) QE failing and rising USD

3) Gas Buddy flat and falling slightly so little if any inflation

4) Debt Limit which will cause consternation until resolution at end of February

Posted in Uncategorized | Leave a comment