Upside now is limited to +2-3% to mid-July.

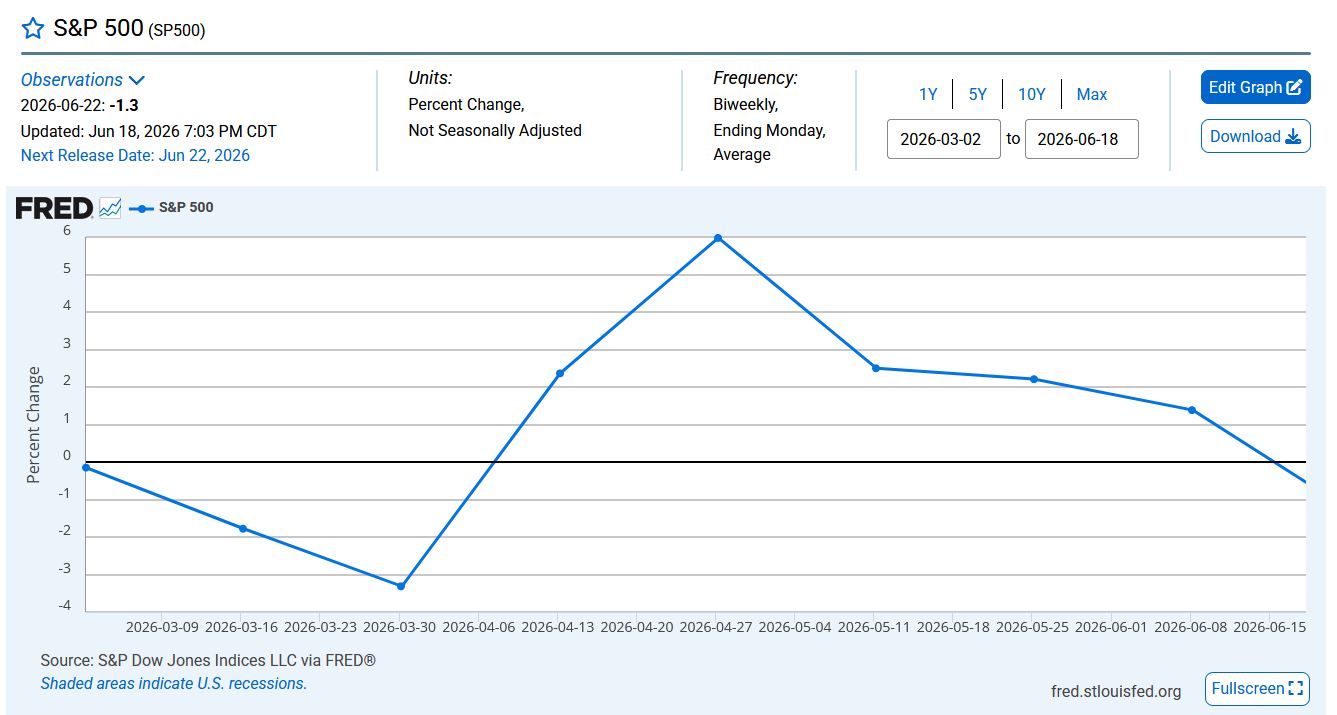

Upside now is limited to +2-3% to mid-July.
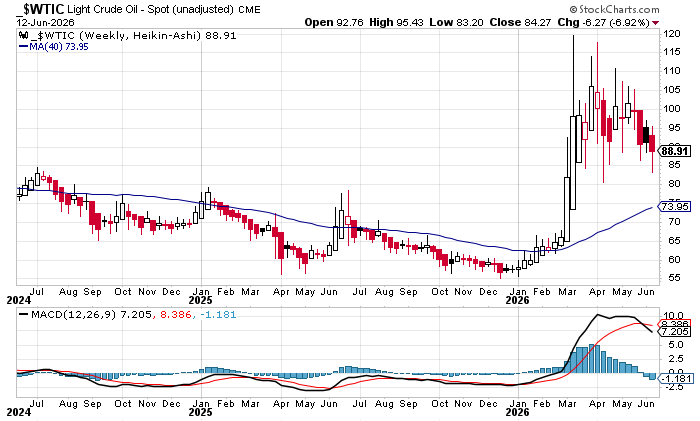
Oil trends down for 3 weeks…
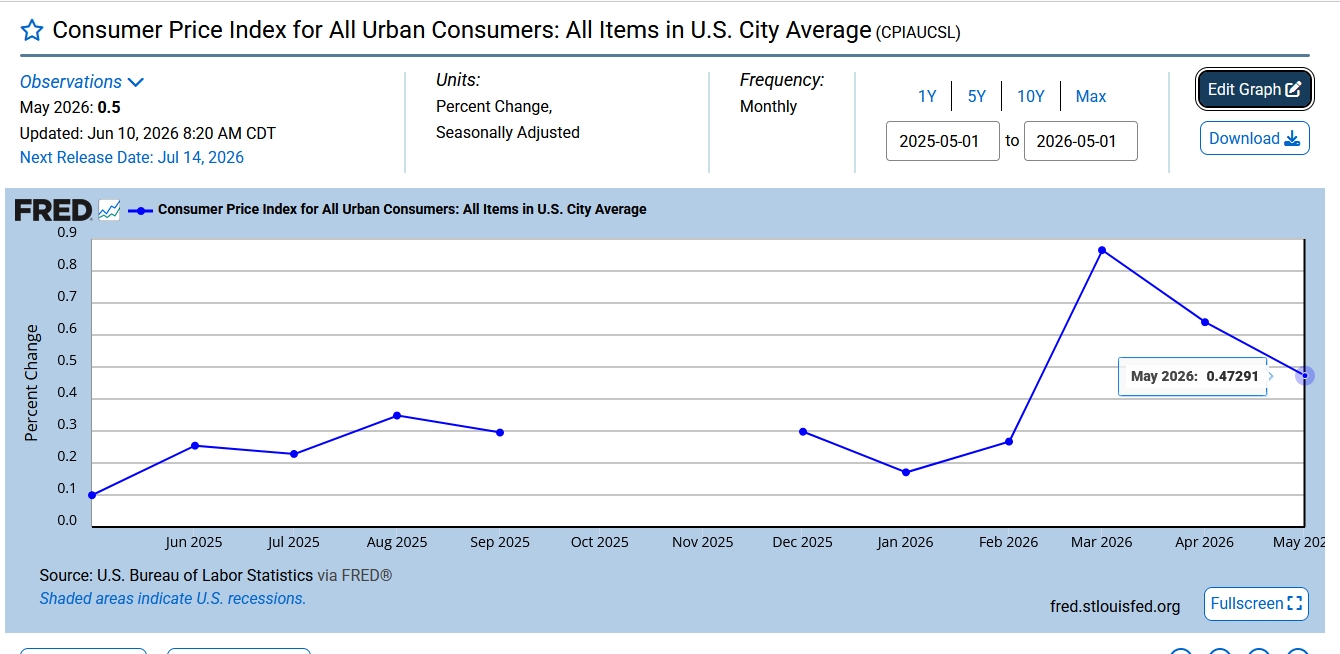
CPI trends down but still high…with June to be low…
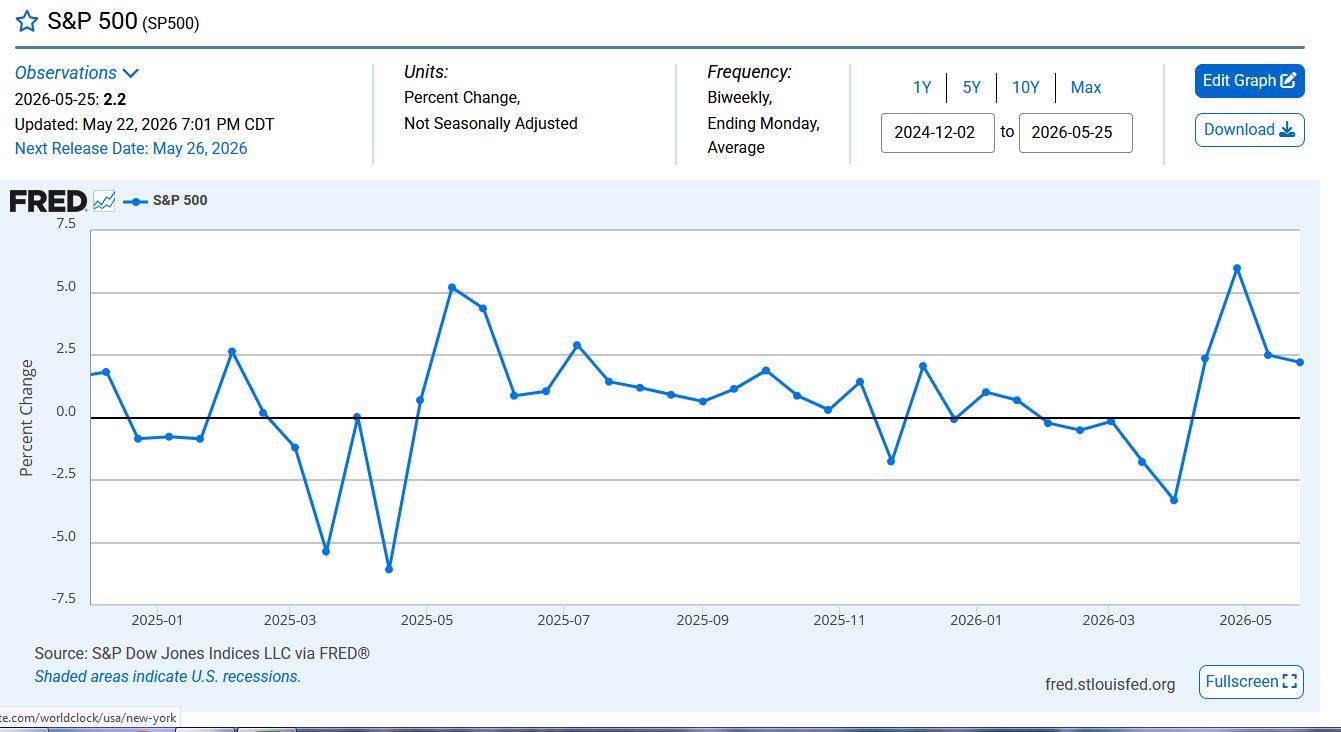
SPY down…BUT still +2% for Jun with up pressure from May but also falling momentum.
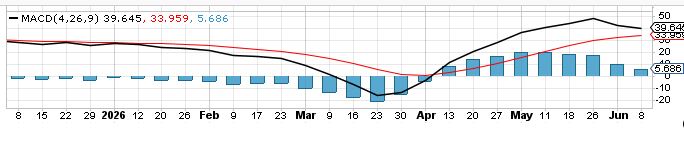
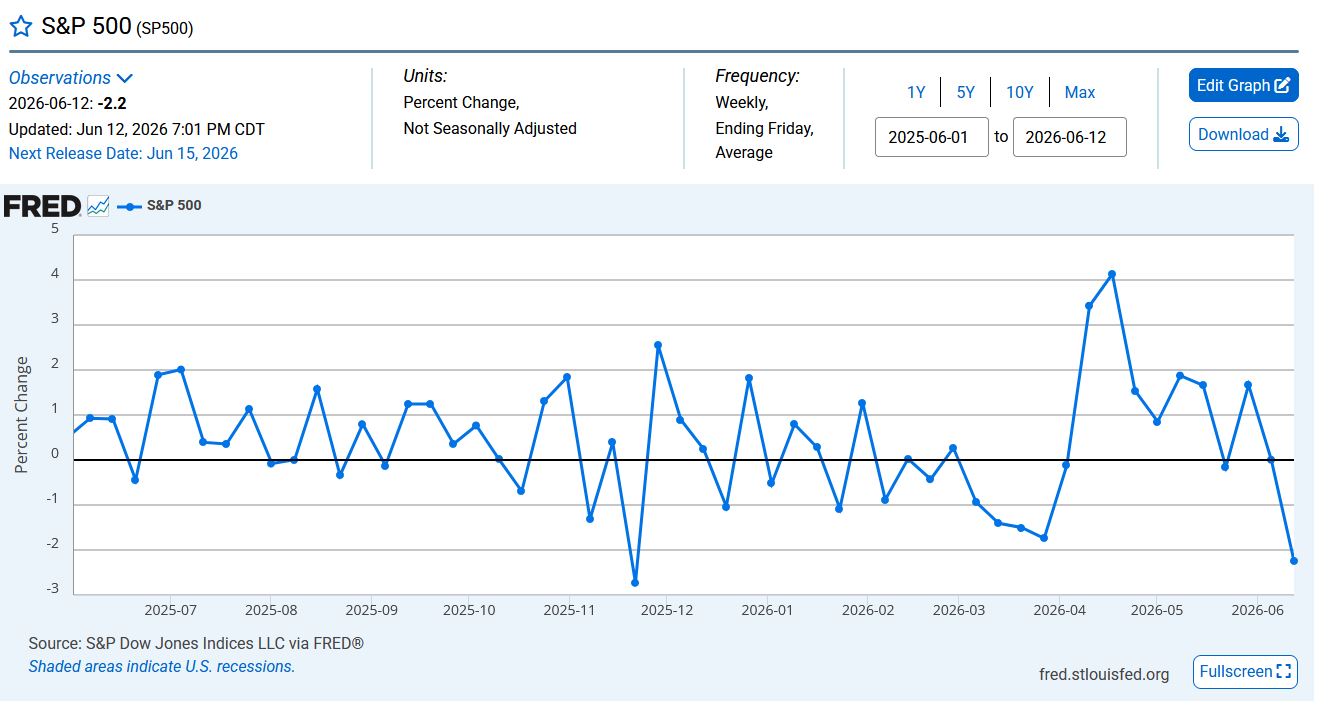
Based on average prices….
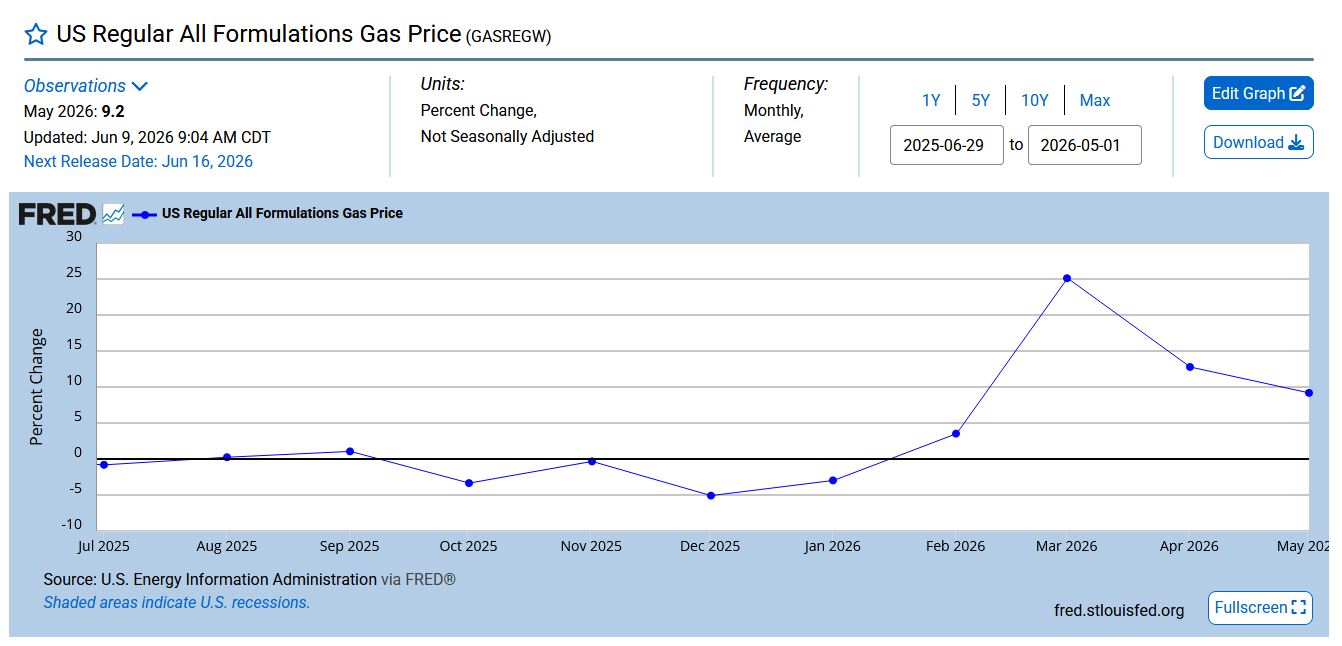
9.2% means 1.47SD
OR
0.25 + 1.47 X 0.15 = 0.47 CPI
BUT liquidity dries up with SPY volatility so prices in June negative.
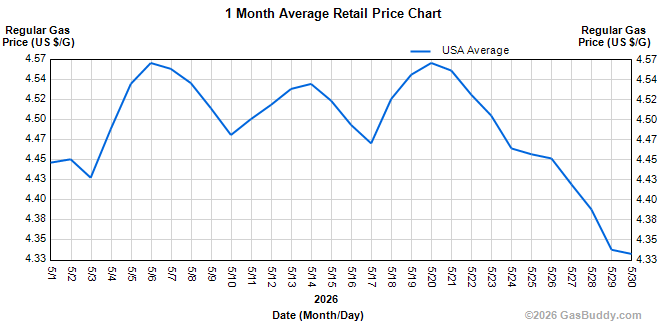
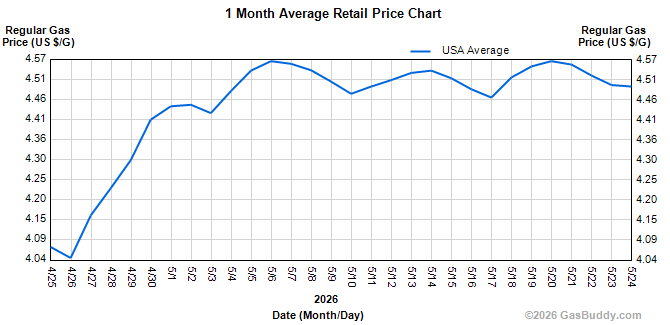
AND Gas prices down for 2 weeks!
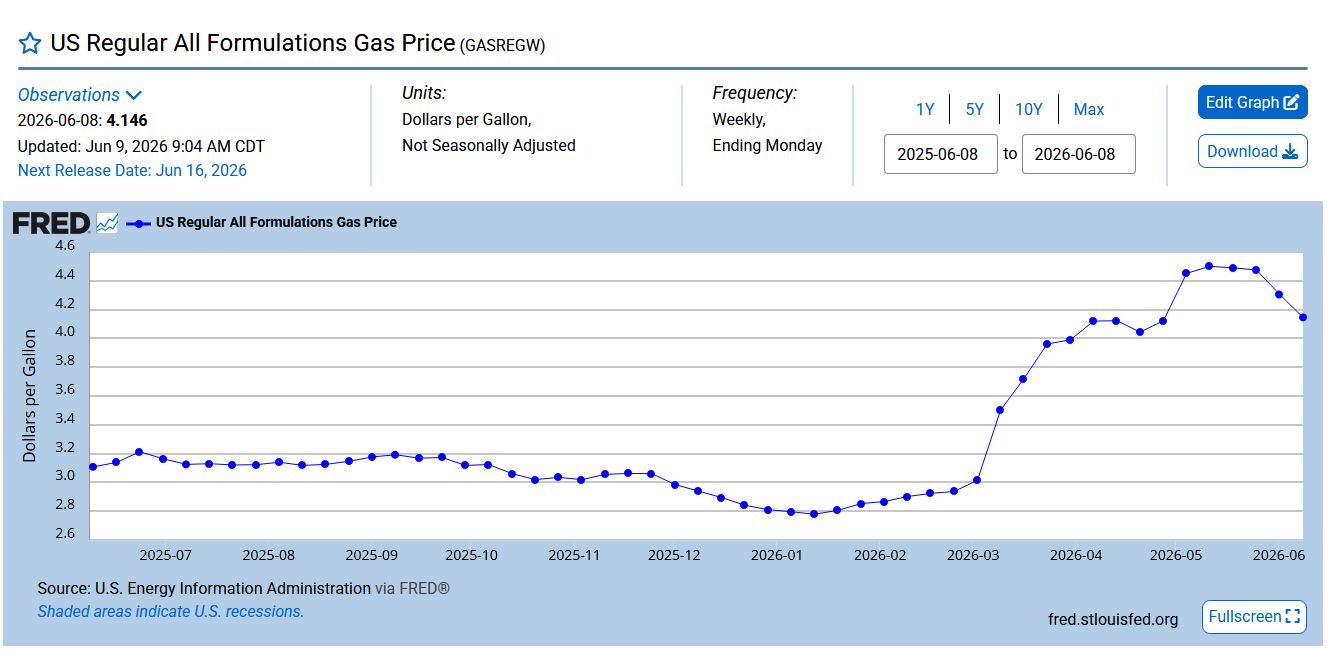
Average Price for May $4.47 and Jun so far $4.15 so -7% …
Volatility in SPY will lead to continued downward pressure on oil and CPI.
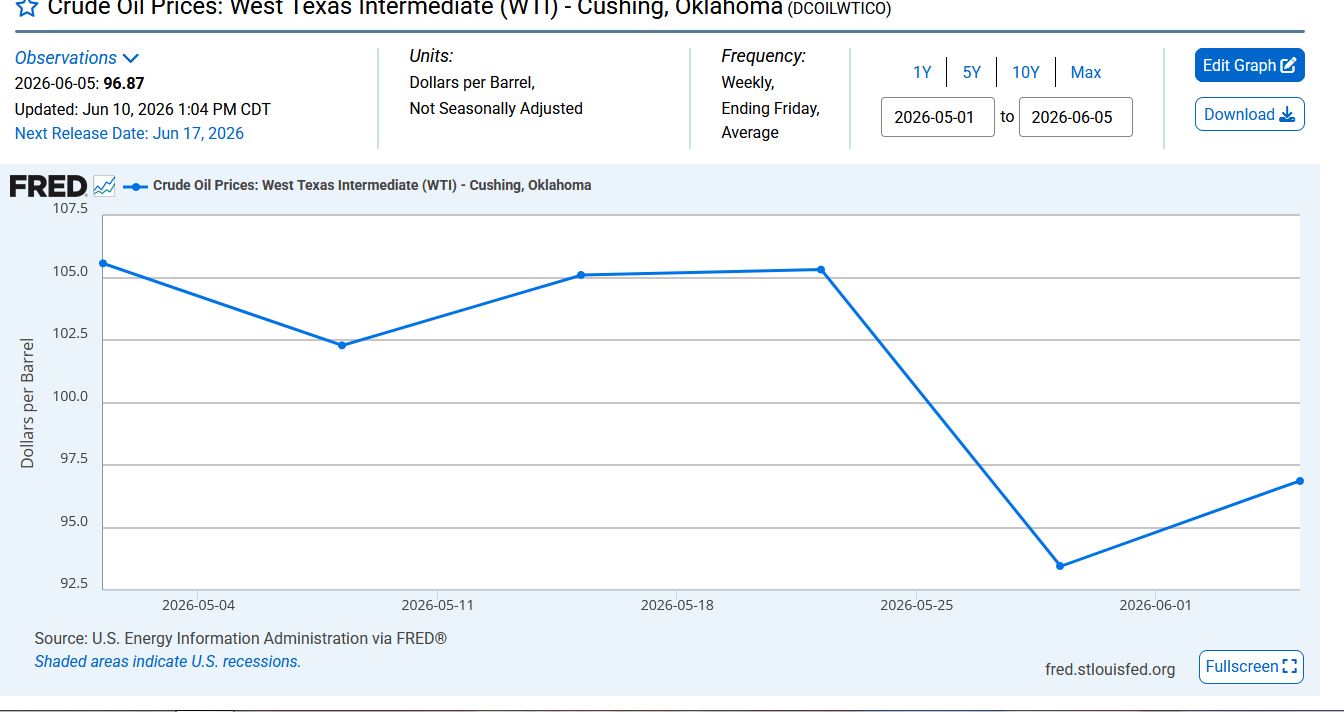
Previous May did have rising oil BUT SPY was on fire with added liquidity…
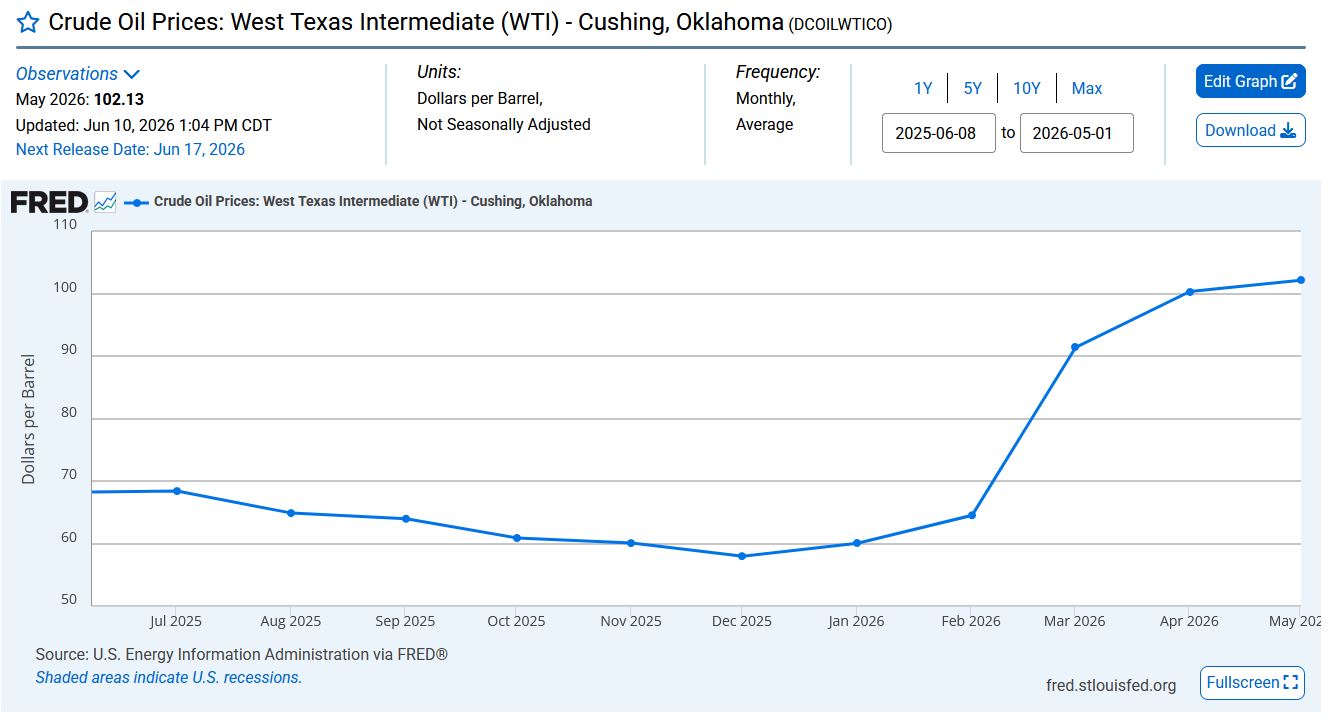
Let’s say oil falls to $87 (average for Jun) then -15% from May translates to -2SD or
0.25 – 2 X 0.15 = -0.05 CPI for Jun.
Despite record breaking stock rally 2023-2026…
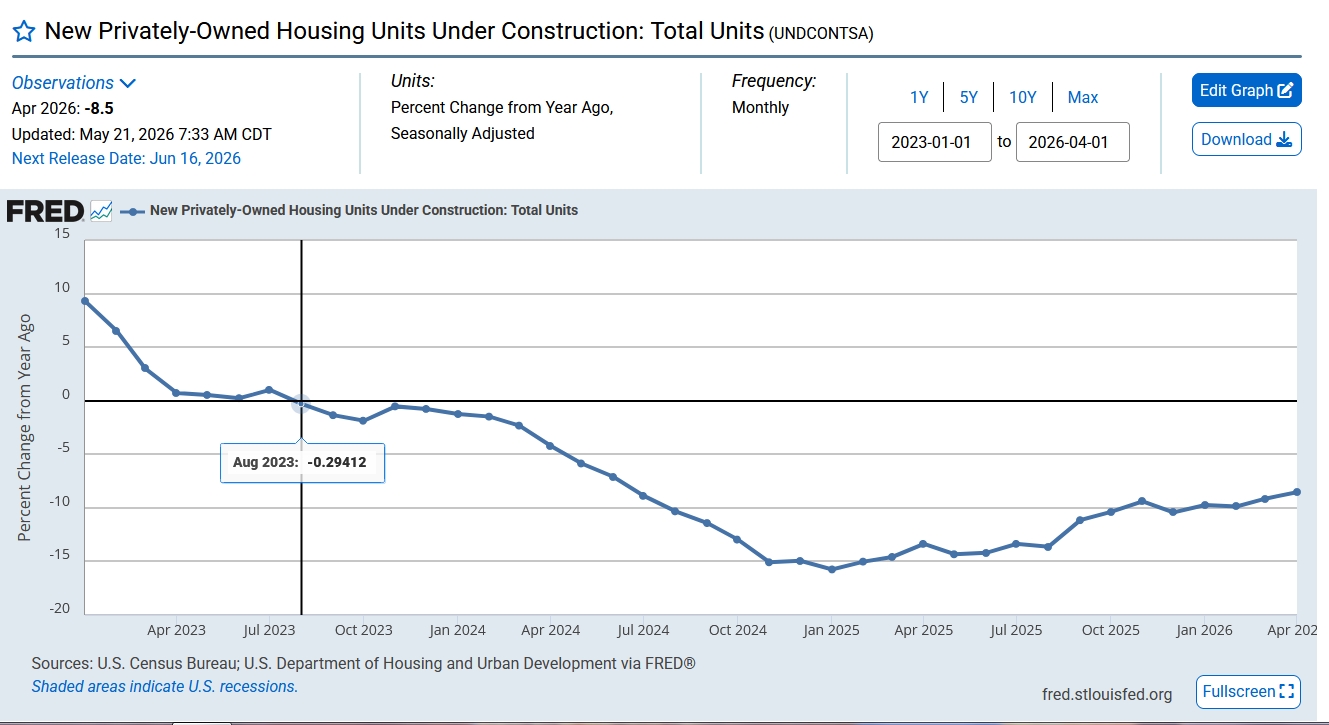
The earliest bottom will be 2031 or 8.3y down cycle…
So CPI will be 0.2 for May….falling inflation now.
BUT earliest drop will be Oct.
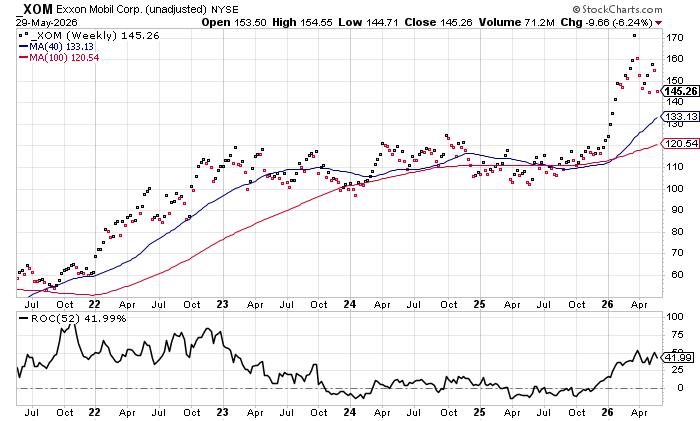
When economy weakens, WS rotates to commodities. XOM is in bull market.
For the next 5-6 years (of course not in a straight line) :
Housing-Construction…down. Commodities are opposite to real-estate/construction.
Cars..down
Tech struggles but down.
Tourism…down
And bonds up as well with weak economy.
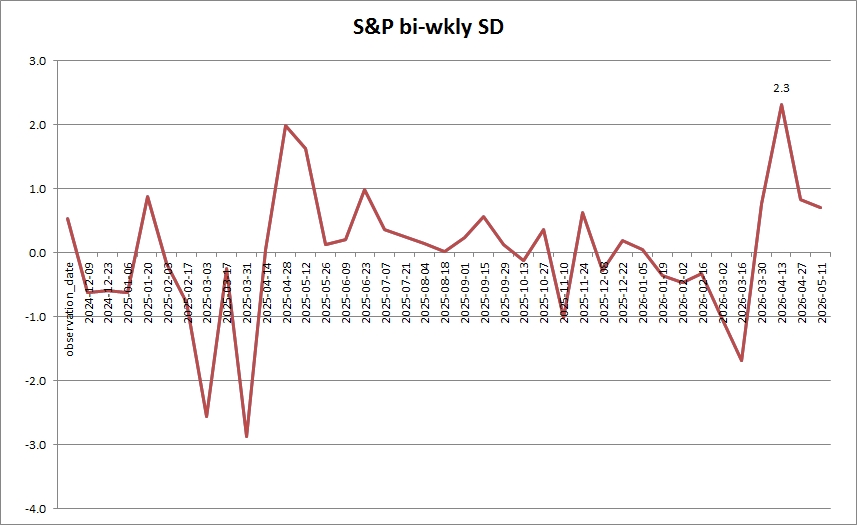
OR bi-wkly change..
Gas more flat in May +2% vs +12% in April
CPI ‘surges’ though…it’s not a straight line.
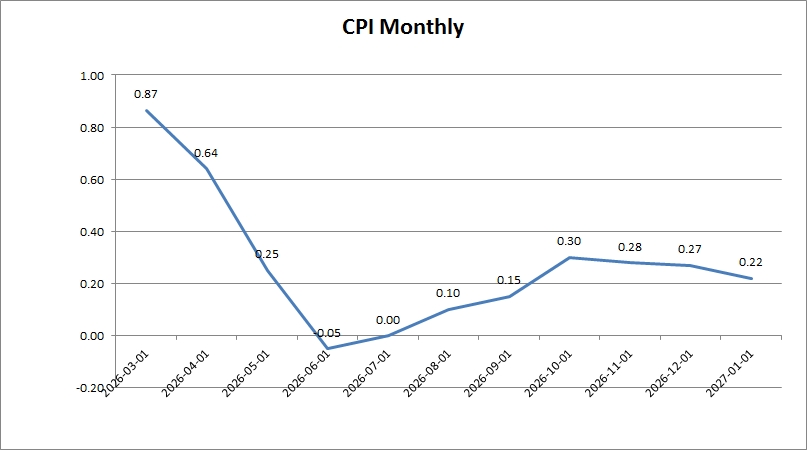
But YoY still high by end of year at 3.2…
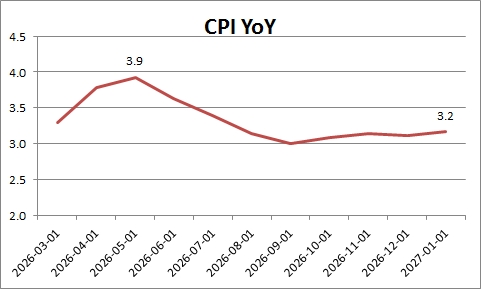
And 2026 marks rising CPI…and more next year and even more 2028!
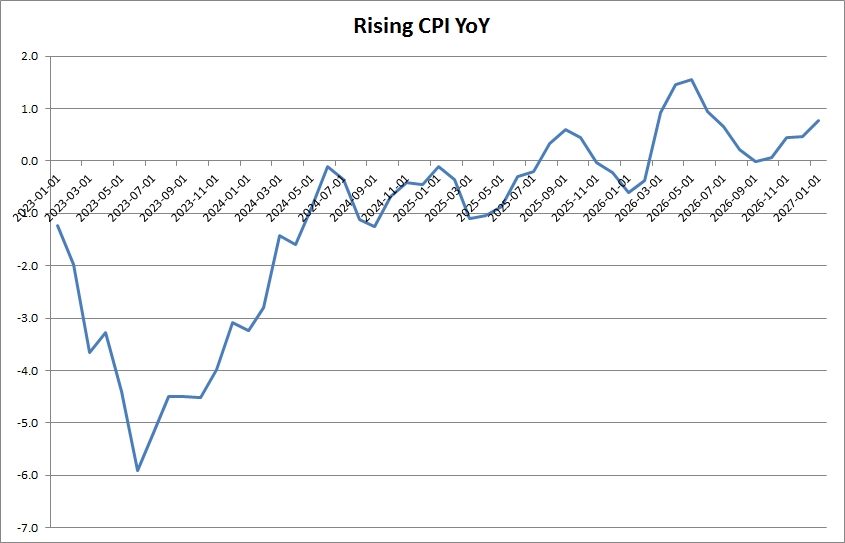
This means weakening economy.
 Credit Flow Investor