Margin Debt at records and Fibonacci’s….SPY 132 and TLT 160 (Nov 2016)

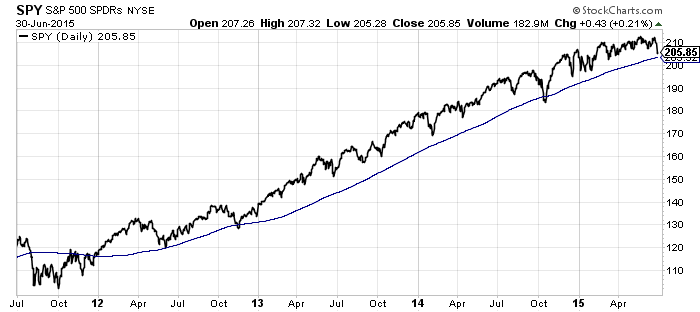
Margin debt grows with each cycle…from Lance Roberts-

Overmargined

Fibonacci

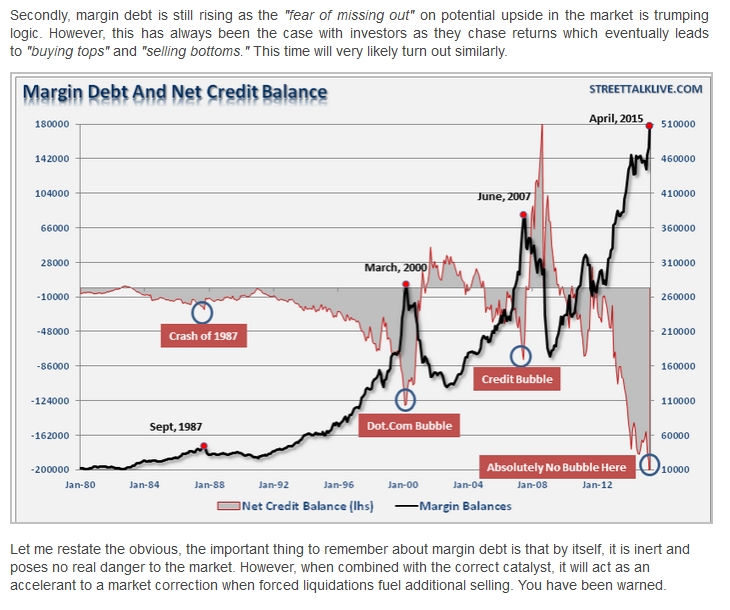
Margin debt grows by Fibonacci levels 38% (approx.) higher each time.

From Investopedia-

Fibonacci retracements use horizontal lines to indicate areas of support or resistance at the key Fibonacci levels before it continues in the original direction.

These levels are created by drawing a trendline between two extreme points and then dividing the vertical distance by the key Fibonacci ratios of 23.6%, 38.2%, 50%, 61.8% and 100%.

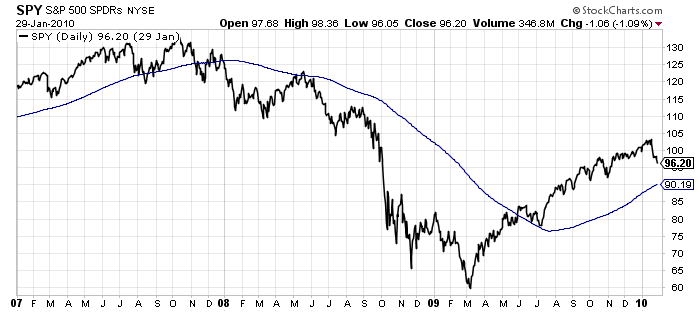
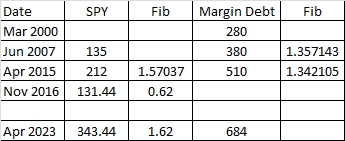
Using the above margin debt as a guide and based on Fibonacci retracements, SPY could hit 132 at the bottom Nov 2016, 2 weeks after election. This would be a 62% or 38% drop level which is less than the 50% level seen in 2008. The drop will be less than 2008 due to inflation being low at this time when entering the recession / bubble deflation.  The bubble will then be reflated for another 7 years leading to a new Fib level 1.62 times higher than currently or 330-340 by 2023 from the 132 bottom in Nov 2016.

1

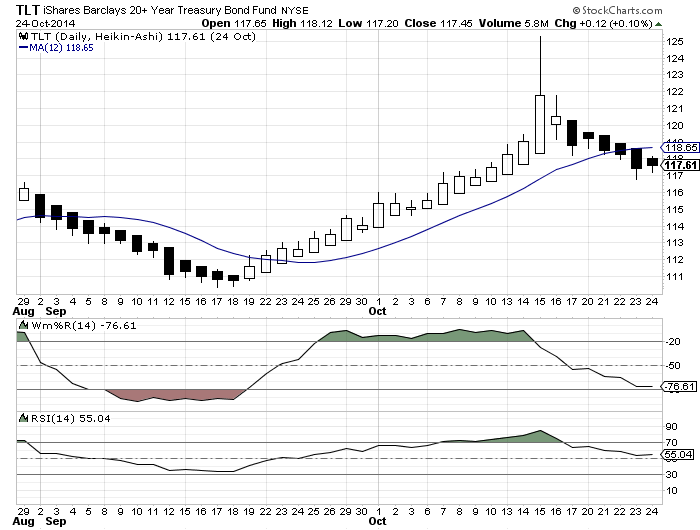
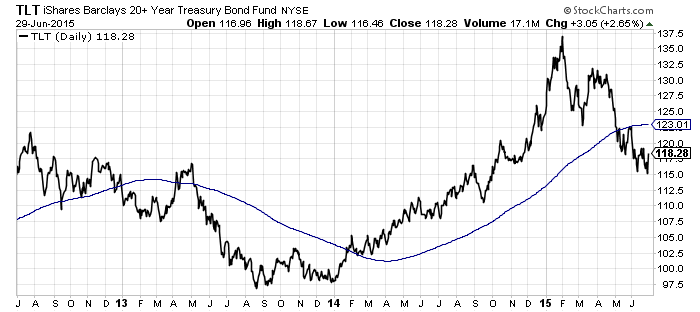
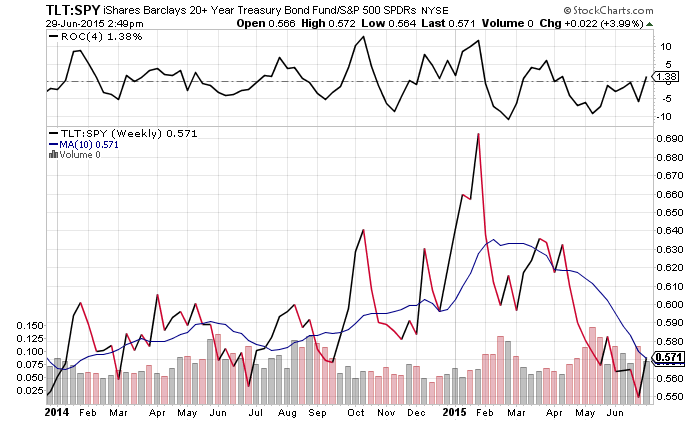
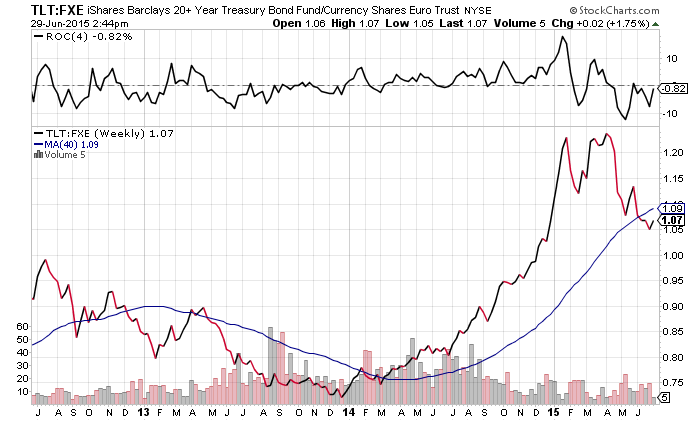
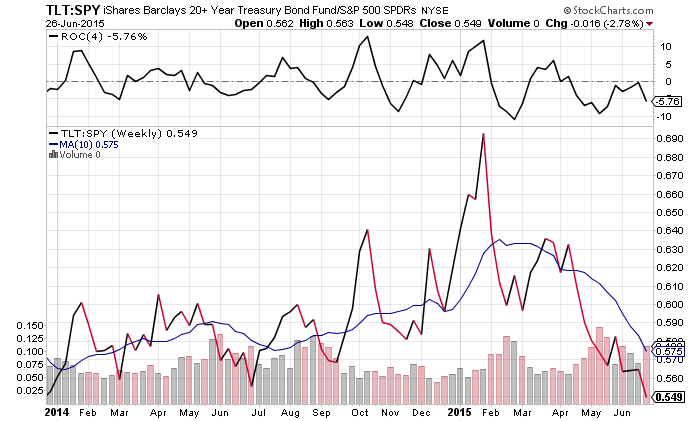
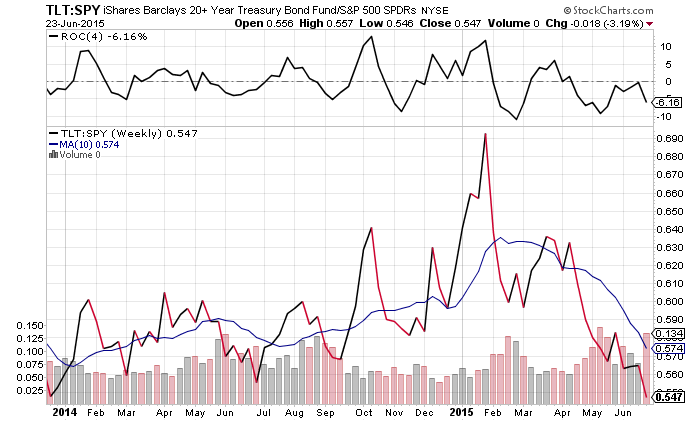
TLT to SPY TLT:SPY ratio in 2008 got as high as 1.4.  For a 38% fibonnaci level rise,  1.38 X 116 brings TLT to 160 in Nov 2016 or a 1.21 ratio to SPY.

Posted in Uncategorized | Leave a comment

TLT and VIX in September…major RUNS are after holidays

The Fed may not raise interest rates after all due to weak demand see core PCE price index (lowest levels since 2010).  They may allow ‘gravity’ to take over as monthly SPY MACD indicates a ‘roll over’ in momentum.  The first negatives since 2008. Daily MACD is not useful.

August can have a limited run BUT major runs are after holidays: Sep-Nov, Dec-Jan/Feb, and sometimes Jun.  Since 2011, every Sep the first 2 weeks TLT goes down and then rebounds.  In 2011, TLT ran Aug/Sep and stayed up due to twist and ccpi at 2.0 being a problem.  As inflation is not near 2.0, August will be a minor run.

TLT may rise over summer Jul-Aug but the biggest runs occur in the fall Sep/Oct or Oct/Nov after Fed meetings.

VIX needs to cross 15 and stay above 15, TLT GHA, and SPY RHA.  When VIX and TLT turn red together, sell. Check at 0935, 1100 and 1300 New York time to see if TLT bar is still green.

Sell TLT if:

SPY gets OS

or VIX RHA, TLT RHA.

The run last Sep was 3.5 weeks. It should be stronger this time as SPY will X the 200dma and QE is off. Oil, of course, needs to be below < 10 wk moving average. TLT:Oil and TLT:SPY need to be > 10wkma.

1

2


core PCE

Lowest core PCE price index since 2010 indicating weak demand.


VIX runs after holidays…

3 VIX 20 events per year. AFTER holidays. Fed policy driven exc for congress once

Posted in Uncategorized | Leave a comment

2015-2017 and ACE

As the bear begins in September (below 200dma), SPY will fall 20-30 points and Oil to $25 from Sep 2015-Sep 2016 (there will be a few small rebounds with LOWER highs). SPY will fall another 20 points from Sep 2016-Nov 2016 and SPY will bottom 8-12 trading days after the election. SPY will settle to about $160 (25% fall) and TLT to $160 as well.

Plan is as follows…

TLT    Sep/Oct or Oct/Nov run          3-4wks

TLT    Dec/Jan 2016 run                     3-4 wks

TLT   Jun 2016? run                             3-4 wks

TLT   End of Aug/1 st wk Sep             12 wks to end of Nov.

(Sell TLT when SPY goes green after election)


SPY   Dec Fed Meeting 2016                6 wks SPY rebound to Jan 2017 Fed Meeting

*DO NOT BUY SPY in Nov 2016!  Wait for the Fed commitment to QE before buying SPY as it can go sideways in December with no momentum as market fears keep it depressed due to the 25% correction and mild recession. They should commit to QE in Dec or Jan Fed meeting. Wait for this event.


ACE…From Jan 2017 onwards, look for VIX 20+ rebound events around Fed Policy changes:

Announcement means a pre-announcement such as Taper Jun 2013. This is not necessarily required.

Commitment means the Fed says they will do it at the next meeting for example Dec 2012,  Dec 2013 (taper) and Dec 2014 (end of QE). BEST TIME TO BUY as the uncertainty is gone and SPY or TLT runs all the way until the next Fed Meeting.

Execution means they actually start the policy such as Jan 2013 for QE and Jan 2014 for Taper and Jan 2015 where the execution is sticking to no QE.

SPY is the play during QE (Fed loosening) and TLT during taper/interest rate rise (Fed tightening). TLT is also a play if ccpi achieves 2.0 which is unlikely in this weak economic environment.

So the best profit occurs C-E or between commitment and execution. The great news here is to simply wait for the commitment and then profit all the way to the next meeting.


Posted in Uncategorized | Leave a comment

Net sales were the largest since January 2008

http://www.zerohedge.com/news/2015-07-01/smartest-money-liquidating-stocks-record-pace-theyre-selling-everything-that%E2%80%99s-not-b

But while we knew that both “vanilla” institutions and hedge funds were actively selling in the public markets, it was not until last week when we got the most candid glimpse of just how much. We described it last week when citing Bank of America who said that “BofAML clients were big net sellers of US stocks in the amount of $4.1bn, following four weeks of net buying. Net sales were the largest since January 2008 and led by institutional clients—after three weeks of net buying, institutional clients’ net sales last week were the largest in our data history.

Posted in Uncategorized | Leave a comment

TLT to USD & SPY 200dma will X 210 this September

1

Here you can see transitions clearly

2012 before qe

2013 qe

2014 taper

2015 ecb qe before int rate rise


ALSO OIL down less than 1% for the week

1

So the current SPY issue is very minor..


SPY getting close to bear mode getting close to 200dma 1.2% away. The current slope of the 200dma is 2.154 points per month.

From today at 203.52, the 200dma will X 210 this September. At that point, the BEAR trap will begin until past the election.  See 2007-2010 below.

SPY 2011


When it X the 200dma, as in 2007 bear begins!

SPY 2007

Posted in Uncategorized | Leave a comment

TLT must X 200dma for BULL mode

1

We’ve not had inflation issues the last few years BUT yellin has hinted about too much asset inflation.  When does SPY fall?  When the FED policy acts against inflation AND the economy is weak.  At that point the Fed has no choice but to proceed until inflation hits a lower level let’s say 40% fall for SPY and 1.0 for core inflation.

All cycles have that character inflation+weak economy..

Biggest bubble here at this time. Since the end of taper, it has gone sideways.

Watch jnk to

2

As low as 16 in the 2008 crash, it has correlation and is a leading indicator for SPY! It goes sideways when qe ends…

3


Posted in Uncategorized | Leave a comment

We have X but no Fed Policy Change

Yes the charts have X and gr,gr,red has occurred BUT the fed has not indicated a policy change.  And greek crisis is a one-off not required to change direction…

2

Notice the rise last july followed by retreat and gain in september….


1

tlt to fxe has not X yet.  Also seasonality indicates a change in sept for fed policy.  So TLT may rise in July and retreat after Fed meeting…to rise in september/october.


Posted in Uncategorized | Leave a comment

Three Charts to Watch…

1

Notice how it fell below the 10 wkma in late March.

2

Here it fell below in mid-April.Good news here is it’s getting cheap and valued thereby driving powerful bounces in Sep/Oct and Dec/Jan.

Both lines must X before TLT considered a bull again.

Monthly Gas transitions also indicate a change for/against TLT. For TLT started Jul 2014 and changed in Feb 2014. No negative gas monthly since Jan 2015.Mo Gas Transitions

Posted in Uncategorized | Leave a comment

OIL X 40wkma …FOLLOW Risk off first.

OIL has X 40wkma first time in a year, so TLT off for a while!

Oil X 40wkma

TLT to oil will have to X 10wkma before tlt considered a bull again. These charts also cover TLT X 50dma which is also bullish.

tlt to oil

2

Gas buddy not as reliable as oil. Oil must always be checked first.

Posted in Uncategorized | Leave a comment

Two Charts show TLT bear for now

I anticipate these will make turns by Fed Mtg in September 16 or 1 wk after….

1

Here below 50dma and 200 dma!

2

Posted in Uncategorized | Leave a comment