Core Inflation needs to fall for SPY to rally

Inflation needs to fall

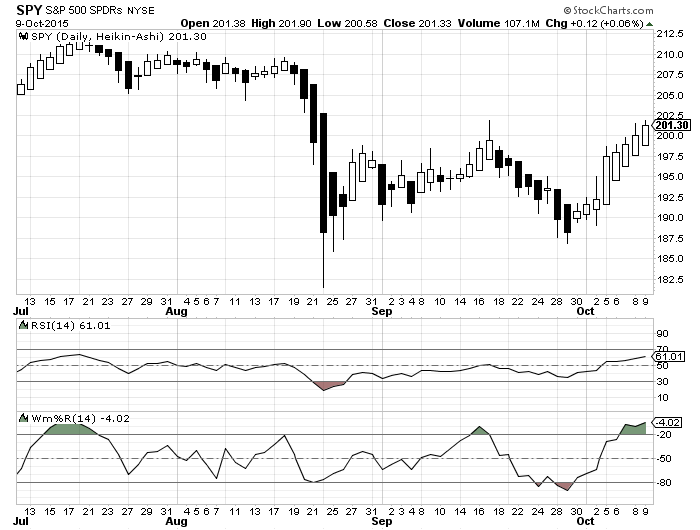
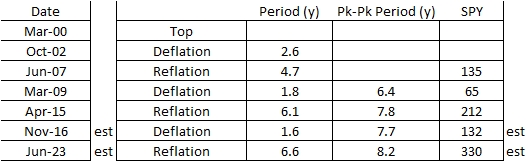
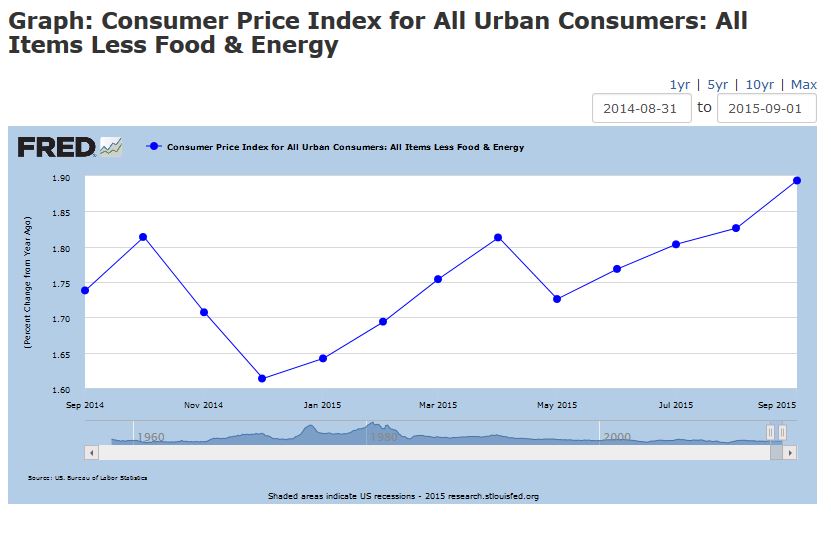
Few realize that rising core inflation causes the Fed to leave an interest rate rise on the table thereby suppressing SPY and causing this oscillation from 189 to 200. Last year it rose again in October and fell in November and December due to seasonality and rising prices just after the summer.

This year will be the same and the Dec Fed Meeting will signal no interest rate rise thereby sparking the Christmas Rally.  January effect will take over starting Jan 4 causing SPY to fail again. The good news is that more oscillations cause a bigger run for TLT in January due to the Minsky effect or stability leads to instability (defined 2 ways below).

DEFINITION of ‘Minsky Moment’

When a market fails or falls into crisis after an extended period of market speculation or unsustainable growth. A Minsky moment is based on the idea that periods of speculation, if they last long enough, will eventually lead to crises; the longer speculation occurs the worse the crisis will be. This crisis is named after Hyman Minsky, an economist and professor famous for arguing the inherent instability of markets, especially bull markets. He felt that long bull markets only ended in large collapses.

From Mauldin Economics:

At the time (in Dec. 2007), I described Minsky’s thesis like this:

[E]conomist Dr. Hyman Minsky points out that stability leads to instability. The more comfortable we get with a given condition or trend, the longer it will persist and then when the trend fails, the more dramatic the correction. The problem with long-term macroeconomic stability is that it tends to produce unstable financial arrangements. If we believe that tomorrow and next year will be the same as last week and last year, we are more willing to add debt or postpone savings in favor of current consumption. Thus, says Minsky, the longer the period of stability, the higher the potential risk for even greater instability when market participants must change their behavior.

FXC RSI below 50

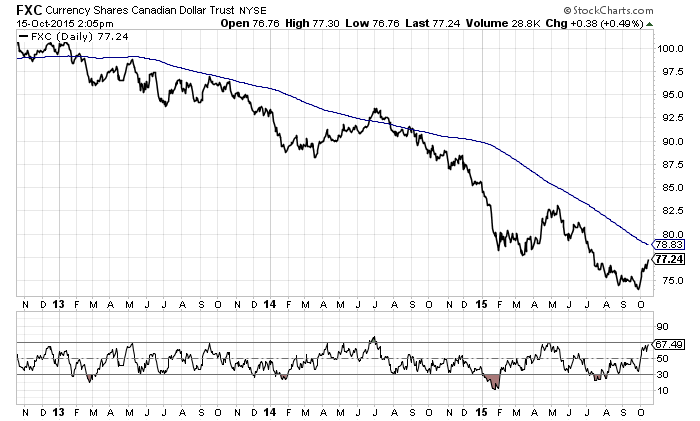
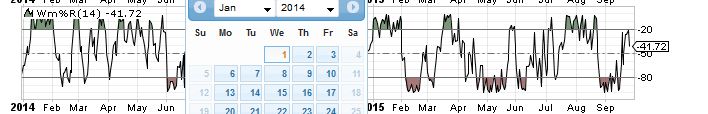
Also Canadian dollar shows strength so TLT not a buy right now…RSI needs to be below 50 on Canadian dollar for TLT to be a bull opportunity.  SO SPY nor TLT are good right now.

Posted in Uncategorized | Leave a comment

SPY spring needs to be rewound to 203-204 (nr 200dma)…World debt increases 40% since 2008

Bad news is the SPY rally appears to be over but will still see by Oct 28.  It only ran for a little over a week indicating a poor spring opportunity.

In order to get a $10 run on TLT, SPY needs to retrace to the 200dma or $2 near it.

Spring rewound2

If spy is near 196-198, then it is similar to the middle spring above.  TLT will rebound but the run will be small $5-$6.  If SPY hits 204 by the Fed Mtg, then it is similar to the last spring and TLT will rebound $10 in November.

If SPY fails to reach 203-204 at Fed Mtg, the next opportunity is after the Christmas rally or Jan 4 2016.


Aside point … Global debt hits record $199 trn or 40% increase since 2008. It’s a 6% yearly increase.

From this video…

Counting the Cost – Is the world addicted to debt?

“Debt was the trigger for the financial crisis in 2008, and what followed – from the collapse of Lehman Brothers to the Greek debt crisis – suggested that the world would no longer fall foul of debt.But debt continues to pile up around the world. It has actually increased by $57tn to $199tn (287 percent of global GDP), according to the McKinsey Global Institute – stifling global economic growth and heightening the risk of more defaults and market turmoil.Is the world addicted to debt? Are we heading towards another economic collapse?”


GOOD NEWS here is that the crisis next year (Aug-Nov 2016) should be very big indeed….great for crisis hunters..

Posted in Uncategorized | Leave a comment

Bi-wkly Gasoline X 0%

Bi-wkly gas 0%

Bi-wkly gasoline shows some strength since Jun-July.  This indicates caution…wait and see.

Posted in Uncategorized | Leave a comment

TLT spring: Oil and SPY…both are reloading

TLT 2 horses chariot

To get a good race or run, TLT needs two horses pulling/springs : SPY and Oil.


Oil spring reloading nicely…

Oil spring reloading


SPY GWm indicates SPY is reloading also. SPY retraced near 200dma or just over is a bear market rally!

SPY up green


This should be a ‘failing’ rally. Next signal is OIL X 10 wkma and TLT:OIL X 10 wkma to the upside.

Then TLT GWm after /near the Fed Mtg Oct 28.


Posted in Uncategorized | Leave a comment

TLT:oil shows bear still

Oil has X the 10wkma and been flat for 1 mo so SPY rally should start the next month. Oil leads SPY by 1-1.5 month. The high VIX 40 in August indicated a month settling time is required!

VIX has been flat this week at 22. Back to back or 2mo straight drops in SPY are rare only at election times 2008,2012, and next year. Notice OEX shows a rally coming as SPY is at bottom right now. Any good economic news in Oct should spark a rally!

TLT target buy is after Fed Meeting Oct 28 when Wm goes green, TLT:Oil and TLT:SPY confirm also.  For now TLT:oil shows bear…

TLT bear

SPY due for rally

2007 oex shows we are now in bear market and a rebound to 50 or so is expected. At least to 10wkma or 37.

OEX 2007

Unemployment claims are fine and economy OK (from Fed point of view). Below is % change in UIC from 1 year ago.

Claims are fine Economy fine


The low gas prices actually should steady the US economy for October rally.

1

tlt wm

Of course, after Fed Meeting is key.  The red Wm has already occurred on TLT in September. I would expect it to go green after Oct Fed Meeting.

Posted in Uncategorized | Leave a comment

Rebound under way

The high VIX indicates an even higher VIX and recession next year.

VIX is down 10 and SPY is up 3.  Sep-Oct TLT run possible but also Oct-Nov.  The last 2 weeks of Sep will tell. If SPY HA starts to fall after the Fed meeting that will be the sign of a TLT run Sep-Oct otherwise it will be Oct-Nov. The Fed may talk up the market in Sep meeting so the TLT run may be delayed until Oct-Nov. GWm needs to turn red first on TLT to setup the rebound when it turns green again.

TLT:$USD has X the 40 wkma indicating a change in Fed policy to tightening.

TLTtoUSD


Posted in Uncategorized | Leave a comment

Recessions every 8 years (w/low inflation)…2016 next

Recessions occur every 8 years when inflation is low…

1972…73, 75..76 (high inflation), 1980…81

1984 (inflation high so 2nd recession), 1991..92

2000-2001, 2008..2009

2016

This explains why 2012 had no recession.  Even Nassim Taleb mentions that the Fed has been able to control interest rates to which I agree. In 2012, the Fed started QE in Sep to stave off another recession and rebuild the labor force. It looks like the Fed prefers 8 years to rebuild the labor force after a recession when inflation is low. AND this is where we are now.. see link UC 20%+ in Reference section…

1

The above is the % change in UI claims from the year before.  When it X 20%, you’re in a recession.

Inflation will remain low as prices are kept artificially high due to low interest rates, lack of demand due to excessive debt, and demographic trends. Due to low interest rates, asset inflation can be high at times followed by significant asset deflation in recessions. Asset bubbles will get bigger and bigger as the Fed drives interest rates lower and lower after every recession.

Therefore, you can expect recessions every 8 years until breaking point in 2038..2040.

Posted in Uncategorized | Leave a comment

Each Policy Change is approx. 1 year (TLT X 200dma)

For non-leveraged positions, SPY/TLT (0cpn) positions use TLT X 200dma as indicating a policy change:

TLT

Apr 2009-Apr 2010 QE-SPY                1y

Apr 2010-Aug 2010 no QE – TLT        4mo (inflation low at ccpi 1.0 so QE expected shortly)

Nov 2010-Apr 2011  QE- SPY               6mo

May 2011- Dec 2012 Twist-TLT           18mo

Jan 2013-Jan 2014   QE – SPY              1y

Jan 2014-Jan 2015   Taper-TLT           1y

(sell signals for 0cpn improved based on Oil X 10wkma and 20% above 200dma

Sell mid-Oct/Nov and at Fed Meetings close in January)


Posted in Uncategorized | Leave a comment

TLT X 200dma wait for GWm after Sep Fed Mtg

TLT has X the 200dma and returned to bull mode see also TLT:Oil and TLT:SPY X 10wkma.  As it is Aug, TLT is not played until Sep. when vacation ends and volumes return.

TLT should fade in the first 2 weeks of Sep. as it normally does. TLT will then be bought after the Fed meeting with GWm (green williams oscillator).

Strategy over the next 18mo has 4 ‘leveraged’ runs:

  1. Buy TLT after Sep FM and GWm, Sell after 3 wks when it exits GWm
  2. 2016 Buy TLT after Dec FM (most likely Jan 1,4) with GWm, Sell after 4 wks at Fed Meeting close
  3. Buy TLT and short JNK when TLT GWm from Sep 1-on, Sell 1-2wks after Nov election when TLT exits GWm
  4. 2017 Wait for new QE commitment (most likely Dec 21). Buy SPY Jan 2 when SPY GWm occurs, Sell at Fed Meeting close Feb 1.


For long term ‘non-leveraged’ positions: Fed ‘mode’ is determined by watching TLT >< 200dma.  As long as TLT < 200dma, hold SPY and collect dividends.  When it shifts above (TLT > 200dma), hold 0 cpn bonds. Sell 0 cpn bonds when oil > 10 wkma (Feb 2015).

The ‘leveraged’ strategy is to play TLT or SPY after vacations, Sep-Oct and Jan, depending on Fed ‘mode’.

Notice each ‘leveraged’ event is after the primary holidays, Aug and Dec. ‘Apr-Aug’ period has lower volumes and makes for ‘noisy’ decisions. Runs are also smaller over the summer for the same reasons. Clear signals occur twice per year, Jan and Sep.

From 2017-2023, ccpi will be range bound 1.0-1.9 with a low growth environment.  Fed will continue with QE (twist unlikely) targeting employment once again until bubbles build too large in 2023.  The bubble will then be burst again as in 2015-2016.

Posted in Uncategorized | Leave a comment

M2 money velocity crosses 0 in 2038 (23 years from now)

A spreadsheet was created to estimate the end of policy stimulus. Estimating from the fall of M2V in Q2 2006 to Q1 2015 brings a 0 crossing event in 2038 when in theory monetary stimulus will fail.

M2 money velocity projection 2015

The Wall Street game of asset bubble management can continue until 2038. It seems each bubble is deflated over 1-2 years and reflated for 7 years…

Reflations

Extending this table out to 2038-2040…3 more reflations ahead getting bigger and bigger as we’ve seen from 2000-onwards:

1


Posted in Uncategorized | Leave a comment